

The Historic Waterfront and the Silicon Slopes
Headline Trends
- A tale of two luxury benchmarks: Providence’s luxury entry point stands at $1,645,675, roughly 29% above the national luxury benchmark of $1,274,423. Salt Lake City’s entry point is $1,247,767, essentially at the national level and nearly 24% below Providence’s.
- Providence has a greater share of million-dollar listings: Salt Lake City has more million-dollar listings, with 417, just over the 358 in Providence. However, the percentage of million-dollar homes is higher in Providence at 20.5% compared to 14.4% in Salt Lake City and 13.5% nationally.
- Luxury homes are currently selling faster in Providence despite higher prices: Homes in the luxury entry tier spend a median of 40 days on the market in Providence, compared with 52 days in Salt Lake City and 59 days nationally.
- Space at one million dollars diverges sharply: In the $1 million to $2 million tier, Salt Lake City homes offer a median of 4,444 square feet at roughly $310 per square foot. Providence homes in the same band offer 2,842 square feet at approximately $515 per square foot.
(Getty Images)
Pilgrims and Pioneers
Providence and Salt Lake City share similar origin stories despite being over 2,300 miles apart and founded over 200 years apart. Providence was founded in 1636 by Roger Williams as a refuge from Puritan Massachusetts. He fled Massachusetts after being banished and sought out a haven for religious freedom. The city of Providence is one of the oldest in the United States, and Rhode Island is one of the 13 original US colonies. Its neighborhoods reflect that history: Federal Hill, Benefit Street’s Mile of History, and a waterfront that has served commerce for nearly four centuries. Brown University and the Rhode Island School of Design anchored an academic and cultural tradition that has persisted alongside successive waves of industrial and post-industrial economic activity. Today, Providence serves as the economic and cultural hub of Rhode Island, drawing from a metro area that extends into southern Massachusetts, with a combined population of roughly 1.6 million.
Salt Lake City was established in 1847 by Mormon pioneers led by Brigham Young, seeking refuge from religious persecution. The state of Utah was one of the last to be admitted into the union as the 45th state. Today, the Salt Lake City metro is home to over 1.3 million residents and has emerged as one of the fastest-growing technology segments in the country. The corridor from Salt Lake City south through Provo, known as the Silicon Slopes, has attracted major employers including Adobe, Goldman Sachs, and a range of high-growth technology companies, drawing in-migration from California and other high-cost metros at a pace that has reshaped the region’s housing market in under a decade.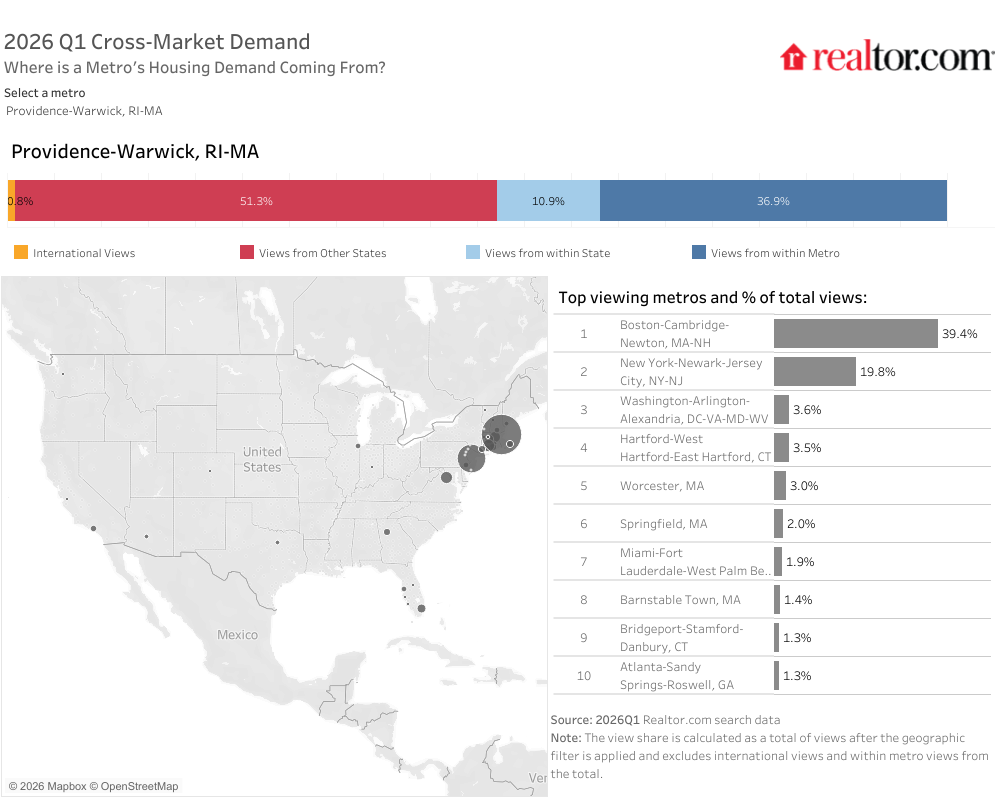
The two metros followed different COVID-19 pandemic-era trajectories. Denver’s luxury tier surged early, peaking at roughly $1.85 million in January 2022. From that peak, Denver’s luxury threshold worked through a pronounced correction, shedding more than 27% of its peak value before stabilizing.
Phoenix’s luxury cycle played out later. The price point for the top 10% of homes climbed more gradually, peaking at approximately $1.76 million in February 2024, two full years after Denver’s high-water mark. Phoenix’s subsequent pullback was more shallow (roughly 15%), and by early 2026, the market had begun trending upward again. The result is a complete role reversal. Where Denver once held a clear luxury premium, Phoenix now sits roughly $148,000 (11%) above Denver at the 90th percentile. Reviewing trends across Denver and Phoenix, it’s clear that prices are more variable in these markets than in other similarly sized cities. The availability of land and the influx of population that these areas have seen tend to be found in areas with more abundant new construction and more volatile prices.
Both metros pull meaningful out-of-market housing demand, but the geographic character of that interest differs. Providence’s demand pipeline is anchored by the Northeast corridor, with Boston accounting for 39.4% of cross-market demand and New York at 19.8%, together representing nearly 60% of external interest. Salt Lake City’s out-of-market demand reflects its position at the center of the Mountain West, drawing primarily from regional metros, led by Denver and Phoenix, two fellow Mountain West markets competing for the same pool of buyers.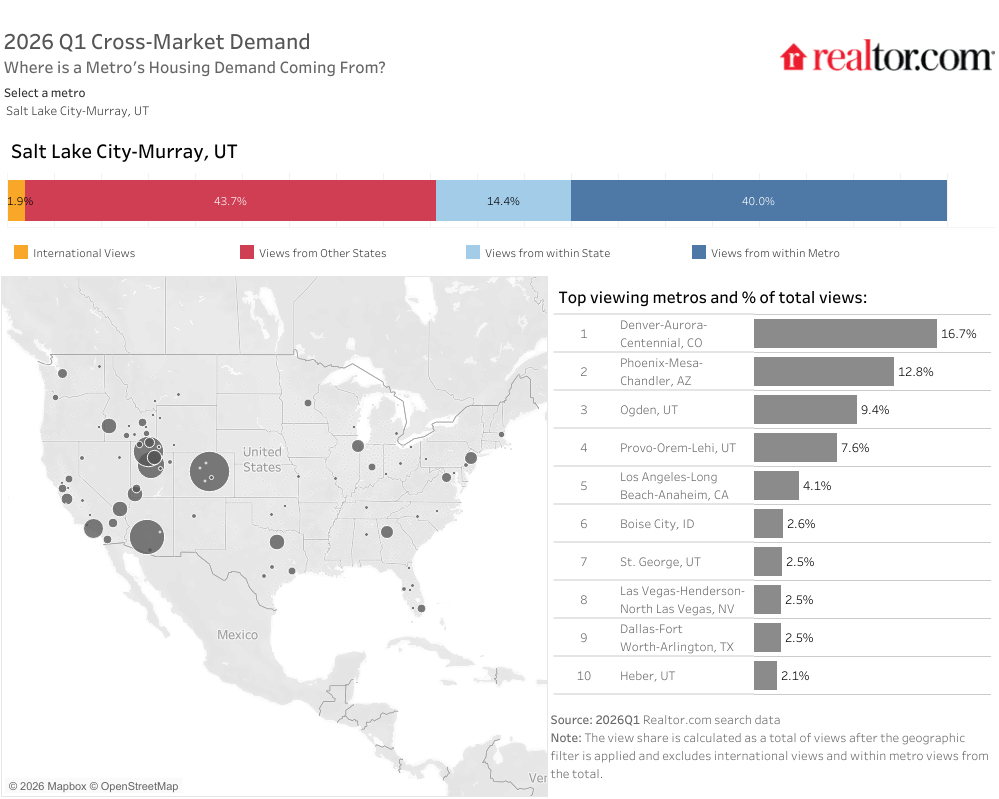
Luxury Pricing: Diverging Trends
Luxury tiers at a glance
| Area | Top 10% (Entry Luxury) | Top 5% (High-End Luxury) | Top 1% (Ultraluxury) |
| USA | $1,274,423 | $2,003,139 | $5,711,785 |
| Providence-Warwick, RI-MA | $1,645,675 | $2,450,000 | $5,996,690 |
| Salt Lake City-Murray, UT | $1,247,767 | $1,815,684 | $3,565,375 |
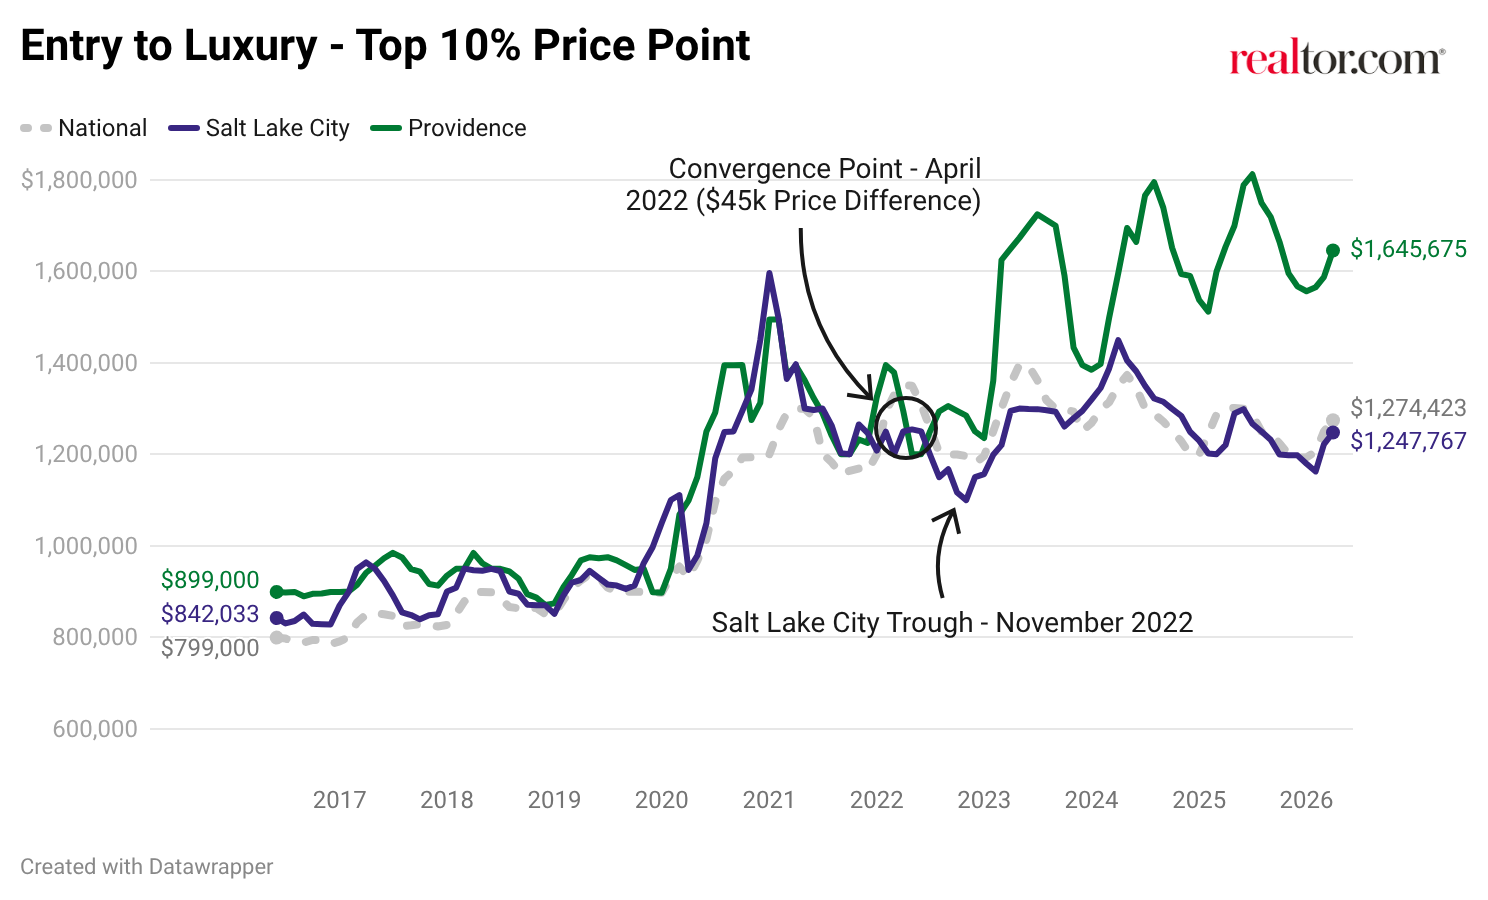
Providence’s luxury tier begins at $1,645,675, placing it roughly 29% above the national benchmark of $1,274,423. That premium is supported by the metro’s constrained land supply, its proximity to the concentrated wealth corridors of Boston and New York, and the enduring scarcity of coastal and historic properties with no modern equivalent.
Salt Lake City’s luxury threshold is $1,247,767, essentially at the national benchmark and 24% below Providence’s. Despite its reputation as one of the fastest-growing technology economies in the country, the Wasatch Front has not yet produced the same luxury price stratification seen in other major tech metros.
That gap is a relatively recent development. Through much of the pandemic era, the two markets tracked closely, and by mid-2022, their luxury entry points had converged to within $45,000 of each other. The divergence that followed is largely a function of shifts in buyer composition in response to markedly different supply trends and new construction activity in the Salt Lake City metro.
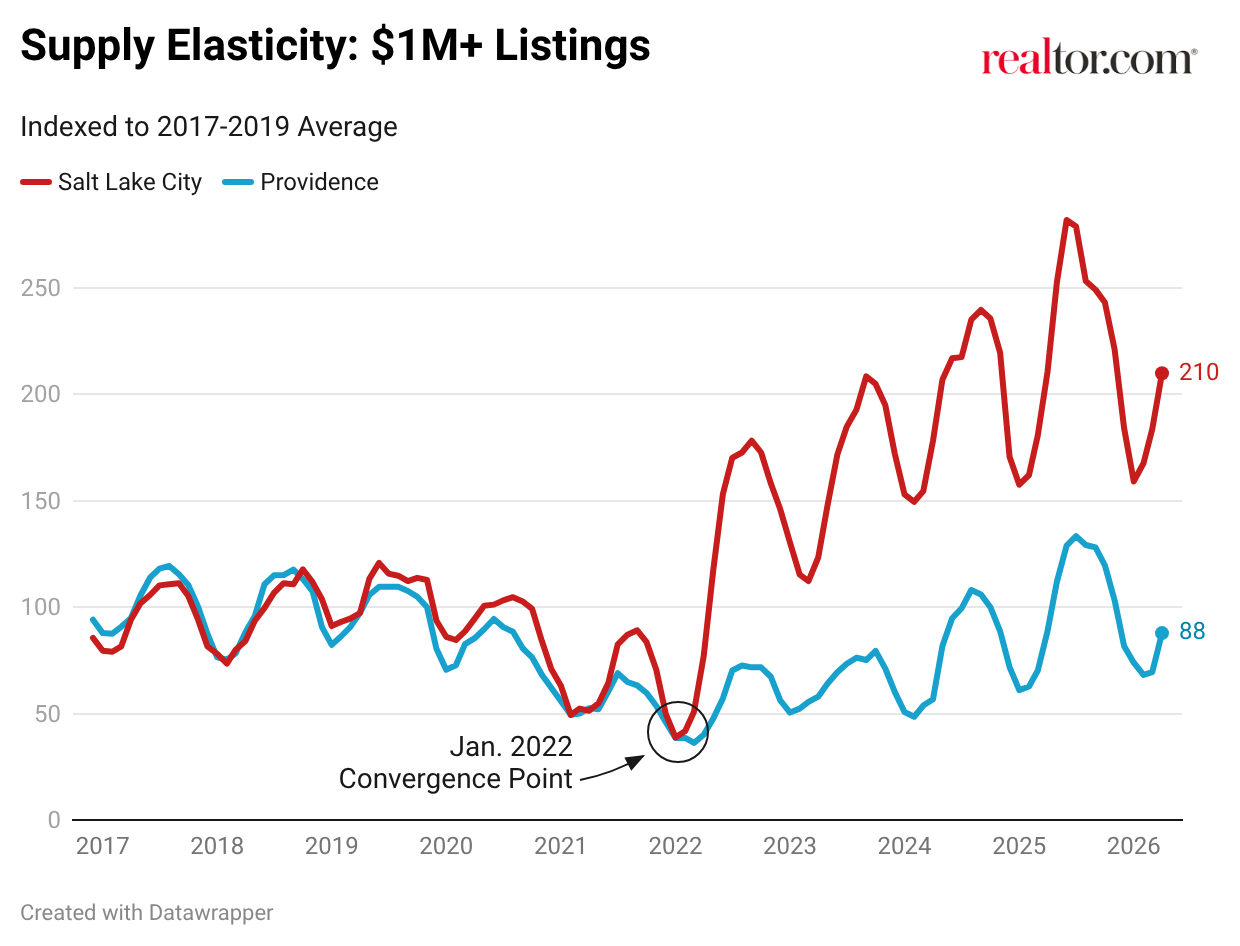
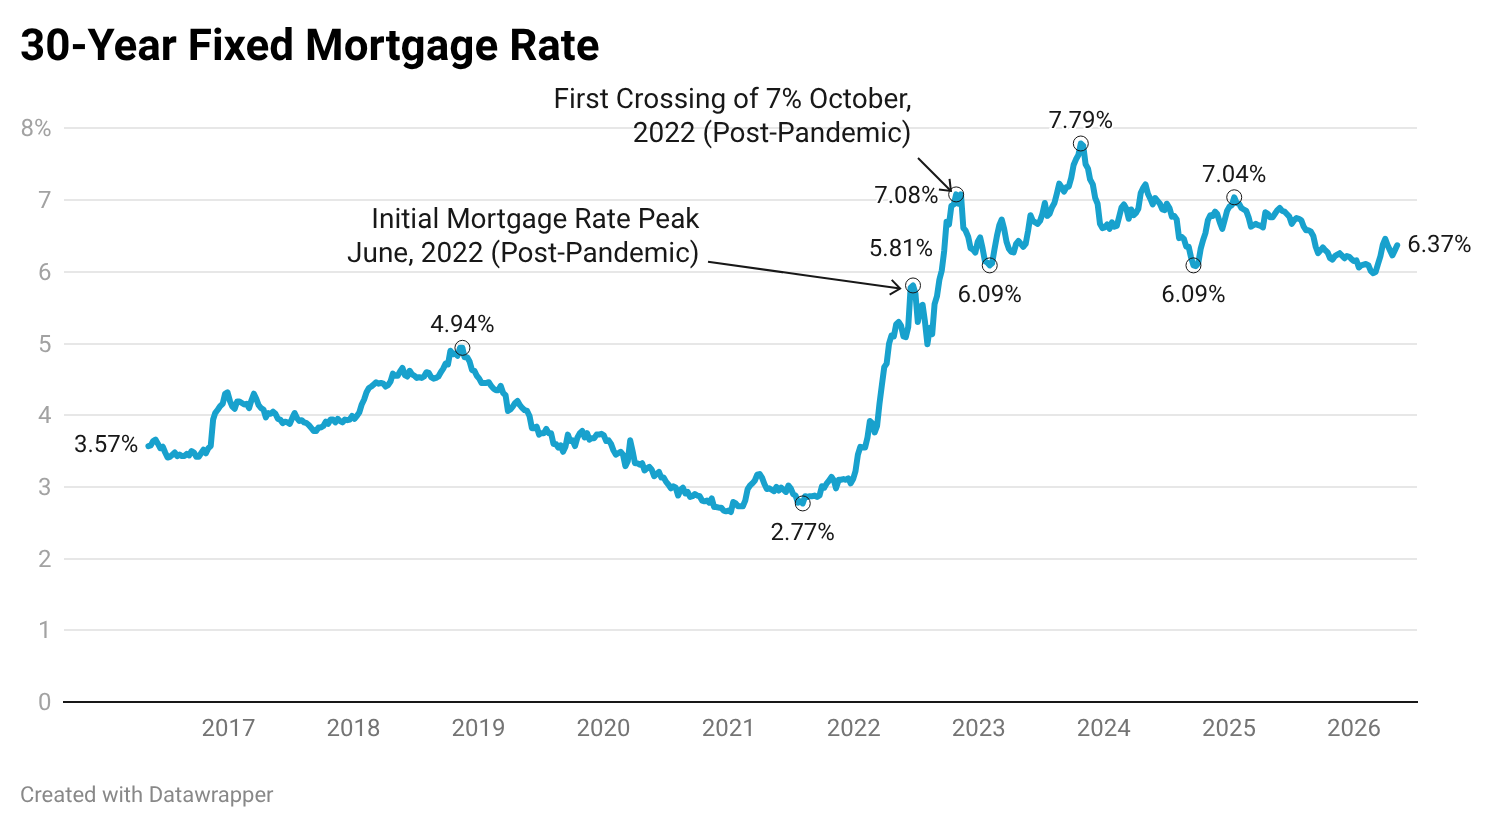
Salt Lake City’s luxury market showed greater rate sensitivity when mortgage costs climbed through 2022. Transaction-level financing data is unavailable for Utah, a non-disclosure state, but the market’s price trajectory gives some insight. Unlike Providence, where coastal geography and historic preservation districts cap new development, Salt Lake City has meaningful room to build, with developable land to the south and west of the metro supporting a continued pipeline of new construction. As the 30-year mortgage rate crossed 5% in April 2022, then 6% by September, and 7% by October, the buyer pool contracted. Salt Lake City, with that supply capacity available, experienced the price recalibration typical of supply-elastic markets. Within months of that rate climb, the gap between the two metros had widened to nearly $180,000, with Salt Lake City pulling back toward the national benchmark, where it has since remained.
Providence’s luxury buyer pool is structured differently from much of the country. Roughly 40% of $1 million to $2 million sales in Providence were cash transactions in 2025, above the national level of 34%. That share fluctuates, but typically sits just above the national level. The cash share also rises further up the price ladder: at the $2 million to $5 million tier, cash buyers account for more than 58% of purchases, compared with 50% nationally in 2025.
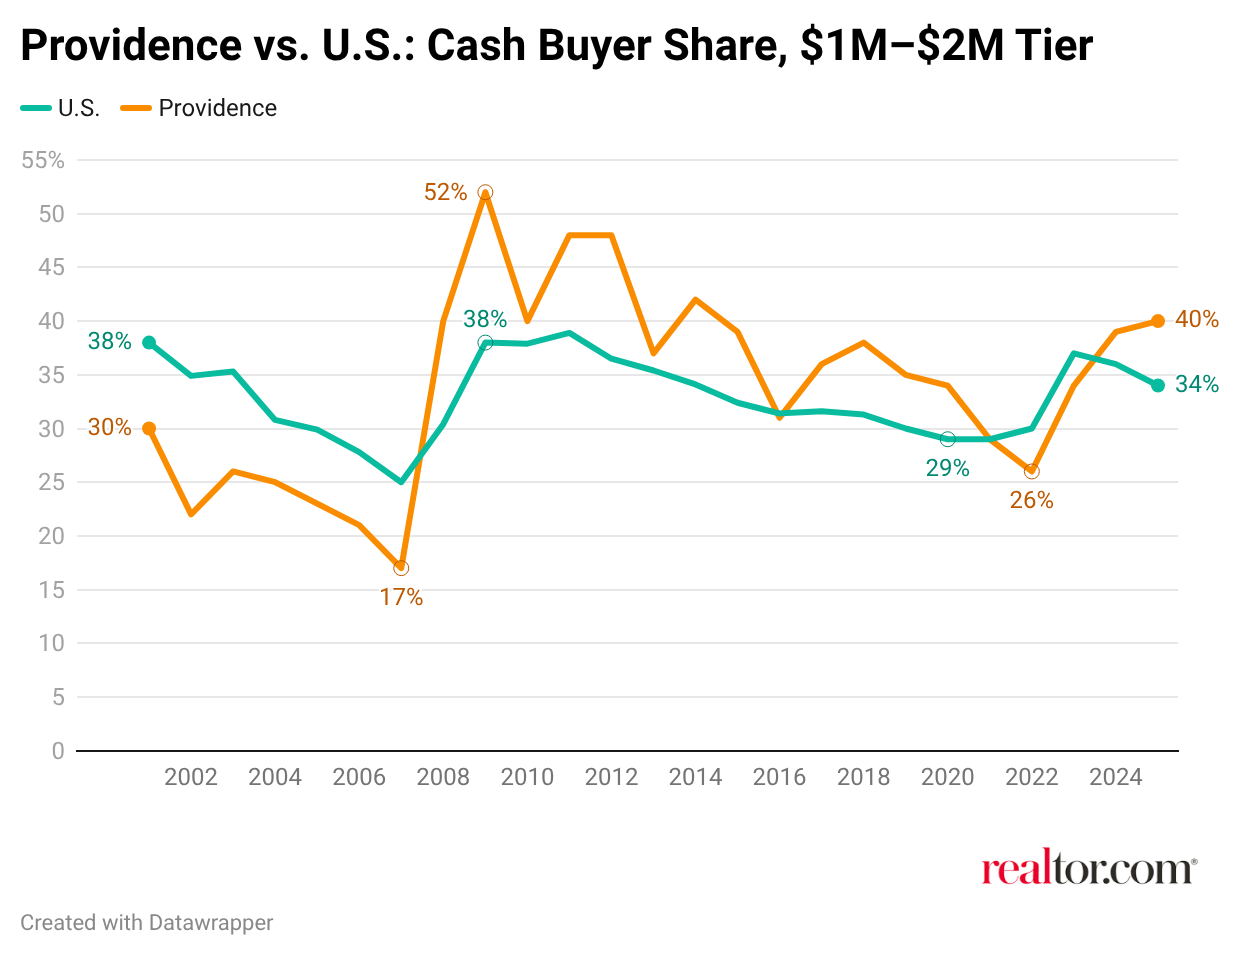
That share had dipped to 26% during the pandemic-era volume surge, as mortgage buyers entered the market alongside the typical buyer base. As rates rose through 2022 and 2023, that mortgage-dependent layer exited, the cash share recovered above 40%, and prices continued to climb against a fixed inventory of coastal and historic properties that carries no equivalent supply response. Providence’s luxury entry point did not peak until mid-2025.
The longer arc reinforces that contrast. From June 2016 to April 2026, Providence’s luxury entry point grew from $899,000 to $1,645,675, a gain of roughly 83%, outpacing both the national benchmark’s 60% increase and Salt Lake City’s 48% rise over the same period.
Inventory Depth and Market Structure
Salt Lake City has added more than 200 active million-dollar properties to its market inventory since mid-2016. Providence’s active inventory of million-dollar homes has lost more than 160 over the same period. That points to some of the differences in the structural dynamics between the two metros. 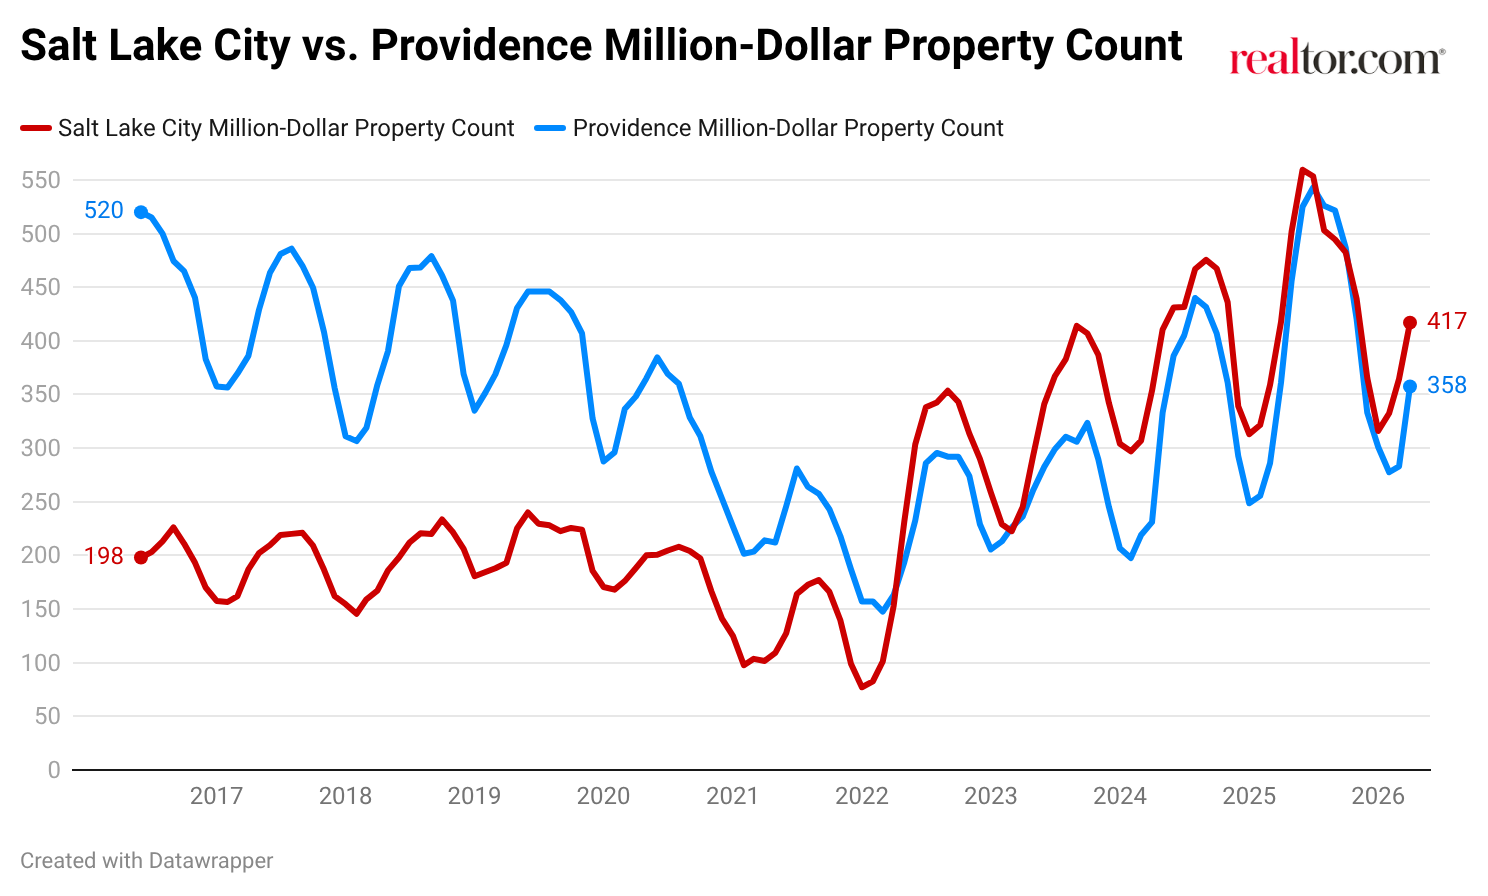
Luxury Tempo
Despite carrying a significantly higher price tag, Providence’s luxury homes are moving faster than those in Salt Lake City.
Homes in the top 10% in Providence spent a median of 40 days on the market in April 2026, 12 days faster than Salt Lake City’s 52 days and 19 days faster than the national luxury benchmark of 59 days. Providence’s pace has also improved substantially year over year, with luxury days on market down roughly 20% compared with the same period in 2025. Salt Lake City showed more modest improvement, down about 9% year over year, while the national luxury benchmark increased 1.7%.
The speed gap reflects differences in how each market is structured. Providence’s coastal and island luxury inventory is physically constrained, with waterfront and historic properties that rarely turn over at any meaningful scale. Buyers, many of them coming from higher-priced metro areas where Providence prices seem comparatively accessible, are likely to feel greater urgency when a luxury property becomes available. Salt Lake City’s luxury market offers more choices, particularly in newly constructed homes, giving buyers more options and more room to negotiate, which naturally extends timelines.
Two Eras of Luxury Housing Stock
Providence’s overall housing stock spans nearly four centuries of construction. Conversely, Salt Lake City is defined predominantly by the last few decades.
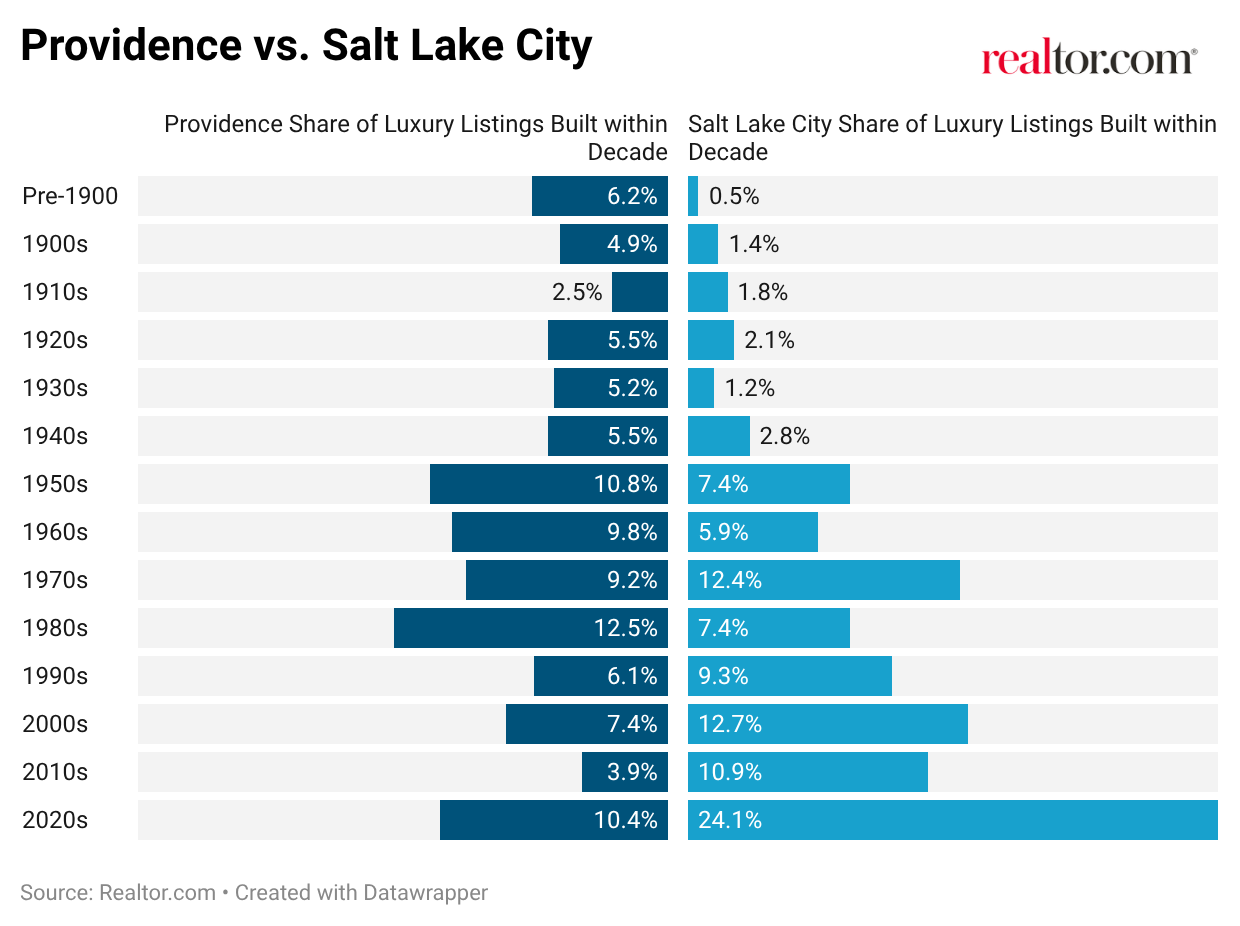
Nearly 30% of Providence’s luxury listings were built before 1950, including more than 6% of the metro’s luxury supply being pre-1900s. The area is home to Victorian-era estates, Colonial-period homes, and Gilded Age mansions. Homes on the East Side and along the Narragansett Bay coastline command a premium largely because they are finite in number and won’t be reproduced. The 1950s through 1970s represent another substantial layer, accounting for roughly 30% of inventory. Homes built since 2020 account for just 10.4% of Providence’s luxury supply, reflecting a market where land constraints and historic preservation limit new development.
Salt Lake City’s luxury market reads as an inversion. Homes built since 2020 account for 24.1% of the luxury supply, the largest single-decade share in the metro. The 2000s represent another 12.7% of inventory, and the 2010s add 10.9%, meaning that nearly half of Salt Lake City’s luxury homes have been built within the last 25 years. Homes built before 1950 account for less than 10% of the market, consistent with a metro whose luxury expansion accelerated in the late 20th century.
For buyers, this divergence defines the experience. In Providence, shopping at the luxury level means navigating a market where age and character are central to the value proposition, with properties carrying architectural history unavailable at any price in most Western metros. In Salt Lake City, the luxury buyer is largely choosing among spacious, modern homes on generous lots, with proximity to world-class ski resorts and mountain trail systems a consistent feature of the offering.
Space and Lifestyle
| $1M-$2M Homes | Median Square Feet | Price Per Square Foot |
| USA | 2,959 | $474 |
| Providence-Warwick, RI-MA | 2,842 | $515 |
| Salt Lake City-Murray, UT | 4,444 | $310 |
The generational divide in housing stock carries directly into square footage. In the $1 million to $2 million tier, Salt Lake City homes offer a median of 4,444 square feet at roughly $310 per square foot, reflecting the region’s newer construction, larger lots, and lower land costs relative to the Northeast. Providence homes in the same price band offer a median of 2,842 square feet at approximately $515 per square foot, a premium that reflects historic character, coastal proximity, and the constrained land availability that defines the Rhode Island luxury market.
Compared with the national $1 million to $2 million median of 2,959 square feet at $474 per square foot, Providence buyers are receiving less space than the national norm while paying a higher per-square-foot premium. Salt Lake City buyers, by contrast, are getting roughly 50% more space than the national median at a significantly lower cost per square foot.
Salt Lake City buyers at this price point are purchasing a large, modern home in a mountain-adjacent market with outdoor access that is difficult to find in many parts of New England. Providence buyers are purchasing proximity to water, cultural infrastructure, walkable neighborhoods, and architectural character that commands a higher per-square-foot premium but produces a different product entirely.
Where the Top of the Market Is Concentrated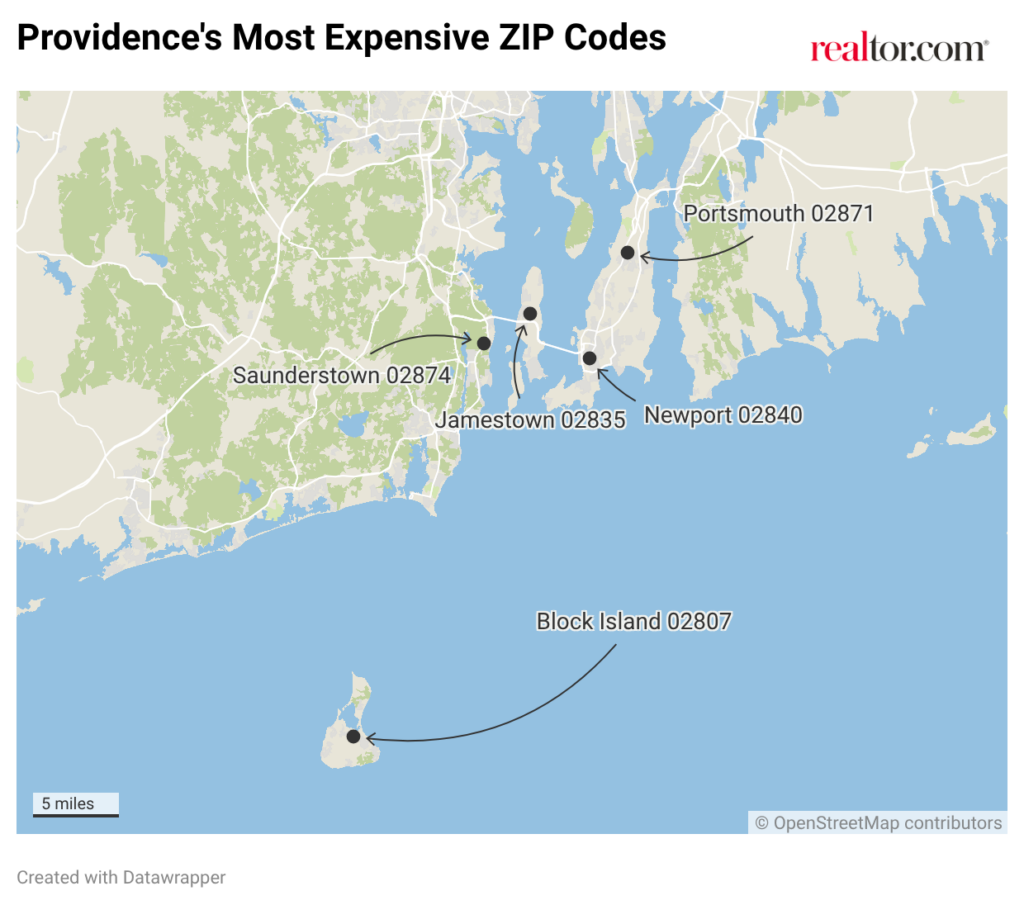
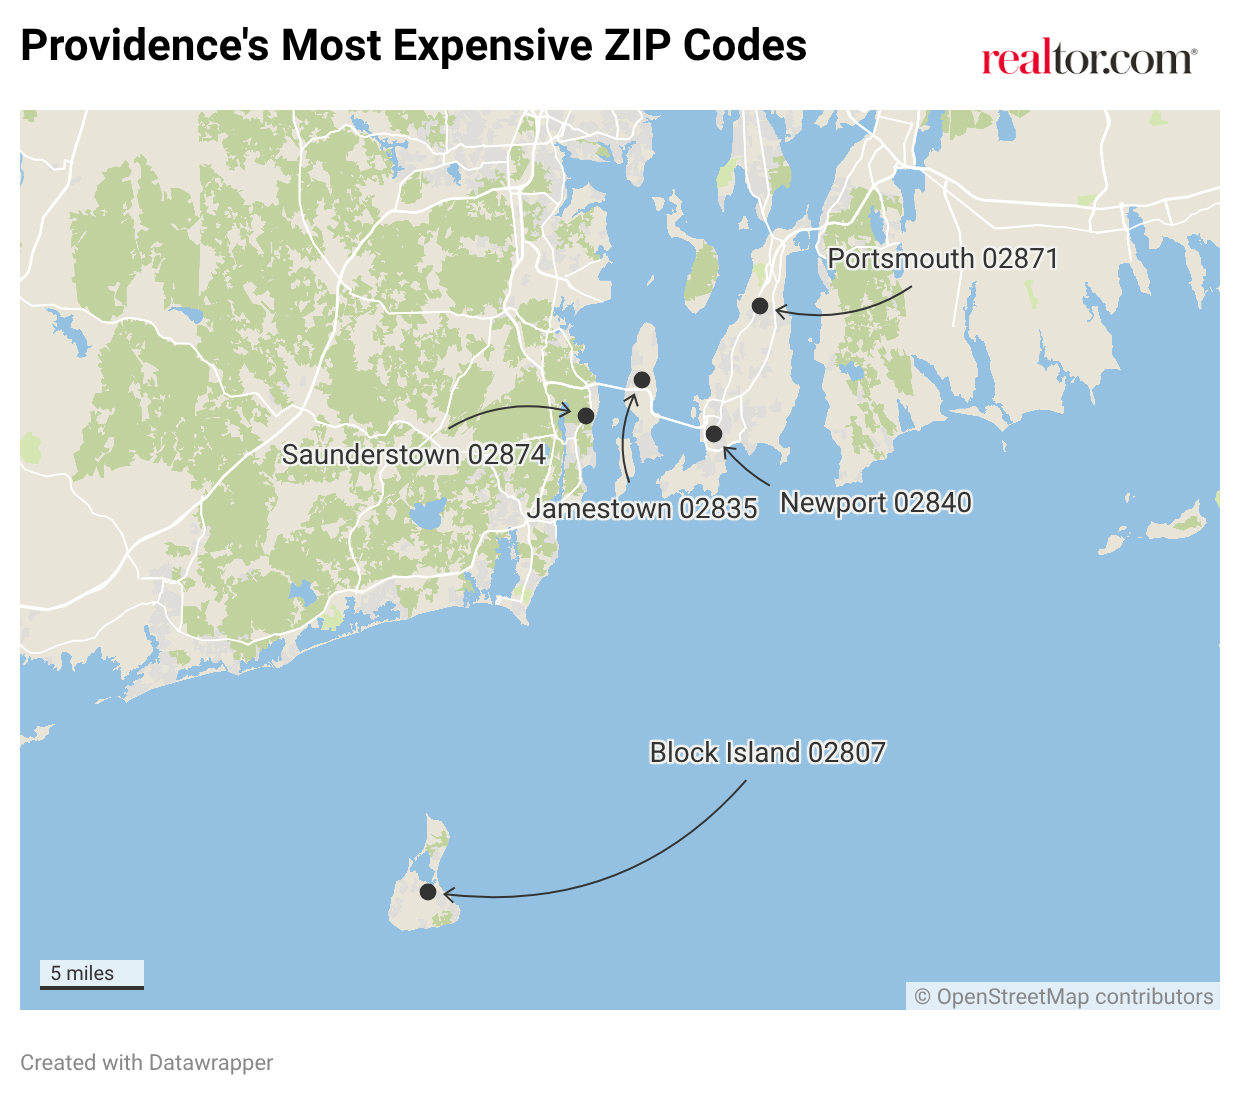
| Rank | ZIP Code | Area | Median Listing Price | Median Square Feet | Listing Count |
| 1 | 02807 | Block Island | $2,616,250 | 2,510 | 12 |
| 2 | 02835 | Jamestown | $1,476,250 | 2,549 | 22 |
| 3 | 02840 | Newport | $1,384,500 | 1,891 | 57 |
| 4 | 02871 | Portsmouth | $1,275,000 | 2,219 | 43 |
| 5 | 02874 | Saunderstown | $1,239,750 | 2,927 | 11 |
Providence’s most expensive ZIP codes are concentrated along the coastline and islands of Narragansett Bay, reflecting the premium placed on waterfront access, island living, and historic architecture in the Rhode Island luxury market.
Block Island (02807) leads the metro with a median listing price of $2,616,250. With just 12 active listings, the island’s pricing reflects extreme scarcity: Block Island sits approximately 13 miles off the coast, is accessible primarily by ferry, and its housing market is defined almost entirely by properties where buyers are purchasing access to a protected landscape that has remained largely undeveloped by design.
Jamestown (02835), on Conanicut Island in Narragansett Bay, follows at $1,476,250, with a housing stock that blends older waterfront estates and newer construction. Newport (02840) ranks third at $1,384,500, with 57 active listings. Newport’s position in the luxury market is shaped by its Gilded Age mansion heritage, its naval history, and its reputation as a premier sailing destination. Homes here are often more modest in size than the price suggests, because buyers are paying for location, historical significance, and coastal access rather than square footage.
Portsmouth (02871) and Saunderstown (02874) round out the top five, each posting median listing prices above $1.2 million. These areas offer a more suburban form of coastal luxury, with larger lots and more contemporary construction than the urban cores of Newport and Providence, while maintaining proximity to the Bay that defines the Rhode Island luxury lifestyle.
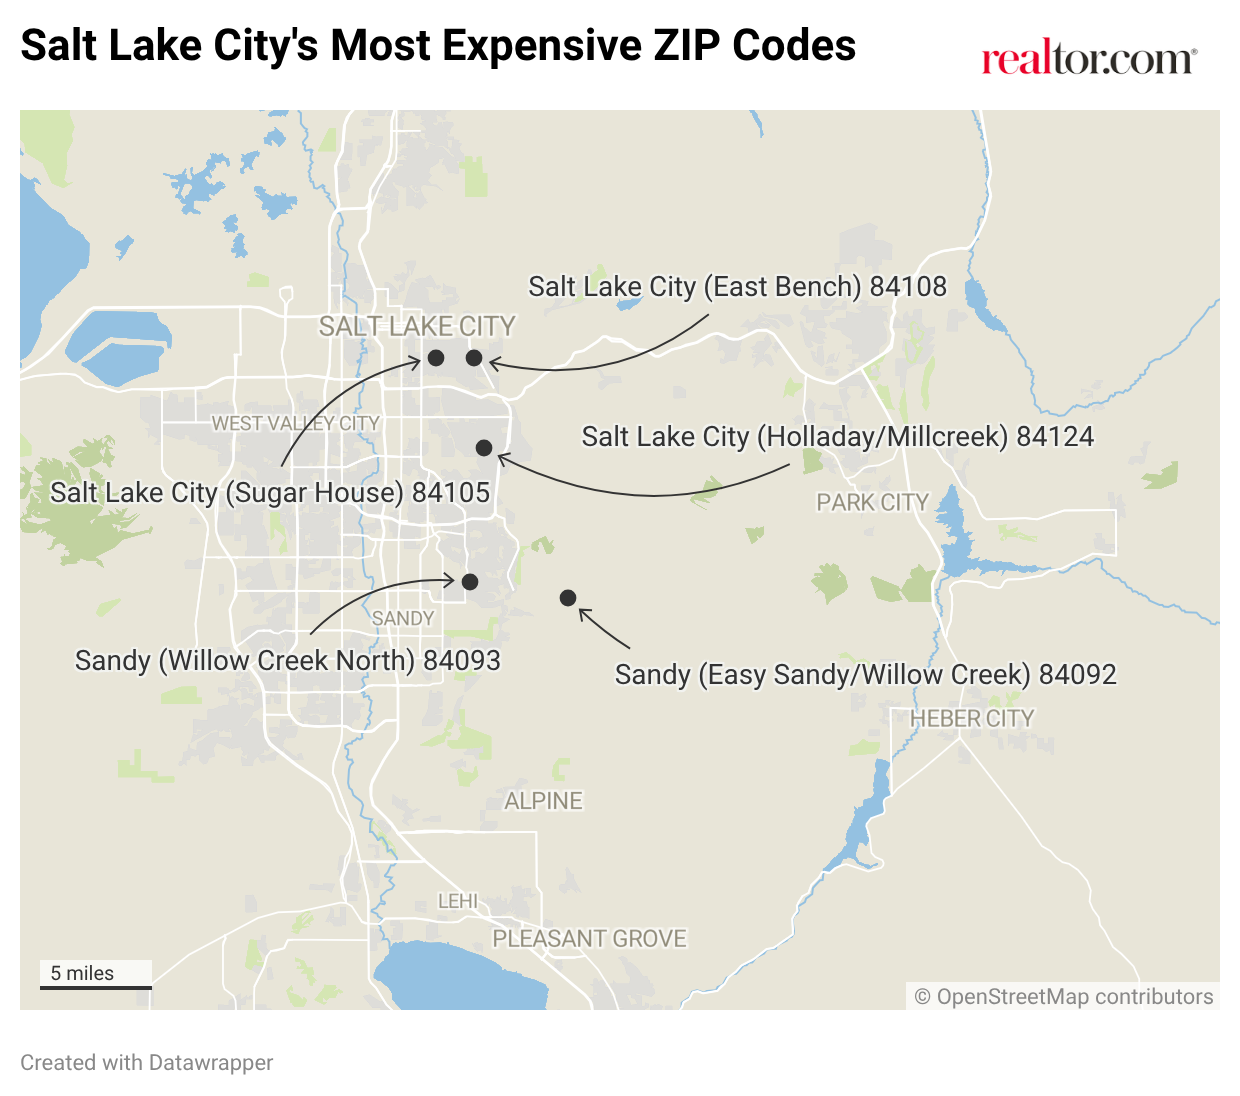
| Rank | ZIP Code | Area | Median Listing Price | Median Square Feet | Listing Count |
| 1 | 84092 | Sandy (East Sandy/Willow Creek) | $1,423,725 | 4,938 | 72 |
| 2 | 84108 | Salt Lake City (East Bench) | $1,046,750 | 2,710 | 32 |
| 3 | 84124 | Salt Lake City (Holladay/Millcreek) | $1,005,000 | 2,710 | 46 |
| 4 | 84093 | Sandy (Willow Creek North) | $973,750 | 3,395 | 35 |
| 5 | 84105 | Salt Lake City (Sugar House) | $944,450 | 2,364 | 27 |
Salt Lake City’s most expensive ZIP codes cluster around two corridors: the foothills of the Wasatch Range to the east of the city, and the Sandy area at the gateway to the Cottonwood Canyons to the south.
Sandy (84092) leads the metro with a median listing price of $1,423,725 and a median home size of 4,938 square feet, by far the largest footprint among the top ZIP codes in either metro. Sandy sits at the gateway to the Alta, Brighton, Snowbird, and Solitude ski resorts, all of which are accessible in roughly 20 minutes. With 72 active luxury listings, it is the most liquid among the top ZIP codes, reflecting genuine breadth of demand. The combination of size, ski access, and newer construction defines Sandy as the primary anchor of Salt Lake City’s luxury tier.
The 84108 ZIP code, covering the East Bench neighborhoods above the University of Utah, follows at $1,046,750. This area occupies a position analogous to in-town luxury neighborhoods in other metros: established by local standards, with views of the Salt Lake Valley and proximity to the university and cultural institutions. Salt Lake City’s 84124 ZIP (Holladay/Millcreek) follows closely at $1,005,000.
Notably, two of Salt Lake City’s five most expensive ZIP codes post median listing prices below $1 million, meaning even the metro’s most prestigious neighborhoods sit close to or below the national luxury benchmark of $1,274,423. This pattern reflects a metro where the luxury tier is scaling actively, but extreme price stratification remains more limited than in older coastal markets.
The Takeaway
Providence and Salt Lake City present two distinct luxury housing propositions shaped by fundamentally different histories, geographies, and demand drivers.
Providence offers a legacy luxury market with a premium that has been accumulating since the colonial era. Its entry-point luxury price of $1,645,675 is 29% above the national benchmark, supported by constrained coastal supply, proximity to Boston and New York, and an architectural character that cannot be recreated. Its luxury homes move faster than the national benchmark, suggesting a buyer pool that is decisive and supply-constrained. That premium has been built over decades and has outpaced Salt Lake City’s luxury growth since 2016, even as the market enters a period of modest normalization at the top.
Salt Lake City’s luxury market reflects a different dynamic. Its entry point, at $1,247,767, is essentially at the national benchmark. What Salt Lake City offers at that threshold is scale: large, modern homes with mountain access and proximity to world-class outdoor recreation that is simply unavailable in the Northeast. Its luxury tier is still appreciating, up 2.2% year over year at the entry point, and its housing stock is overwhelmingly new construction, appealing to a buyer profile drawn to contemporary amenities rather than historic character.
Between these markets, the difference is not just about price. It’s also about the type of luxury buyers are purchasing: the scarcity premium of a constrained coastal and historical market where the supply ceiling is real, or the value proposition of a growing Mountain West market where a million dollars still buys nearly 4,500 square feet of modern construction at the base of some of the country’s best skiing.
Methodology
All data in this report is sourced from Realtor.com® listing trends as of April 2026, reflecting active inventory of existing homes, including single-family residences, condos, townhomes, row homes, and co-ops. Listings reflect only those posted on MLS platforms that provide listing feeds to Realtor.com. New-construction listings are excluded unless actively listed on participating MLSs.
Luxury segmentation is based on market-specific price percentiles, with the 90th percentile representing entry-level luxury, the 95th percentile marking high-end luxury, and the 99th percentile indicating ultraluxury. All calculations are based on listing prices, not final sales prices. For more on luxury methodology, see realtor.com/research/what-is-luxury/
Metropolitan and micropolitan areas are defined using the Office of Management and Budget’s OMB-2023 delineations, with Claritas 2025 household estimates used for relative comparisons. Where appropriate, we limited the analysis to metros or micros with a minimum average number of active million-dollar listings over the past year to ensure meaningful comparisons.
Historical listing trend data extends to July 2016, but year-over-year comparisons in this report use April 2025 as the baseline.
Luxury by the Numbers
90th percentile = Entry-level luxury (top 10% of prices)
95th percentile = High-end luxury
99th percentile = Ultraluxury (often rare or custom properties)


