
Welcome to this weekly housing trends update, where we bring you the latest snapshot of inventory trends, listing activity, and buyer-seller dynamics across the U.S. housing market. In addition to our monthly housing trends reports, which offer deeper insights into long-term patterns, we publish these weekly updates to provide more timely views into market changes. This effort began in response to rapid shifts in the economy and housing landscape.You can count on a new Weekly Housing Trends update, fresh weekly data each Thursday, and a weekly video from our economists to help you stay informed.
What this week’s data shows
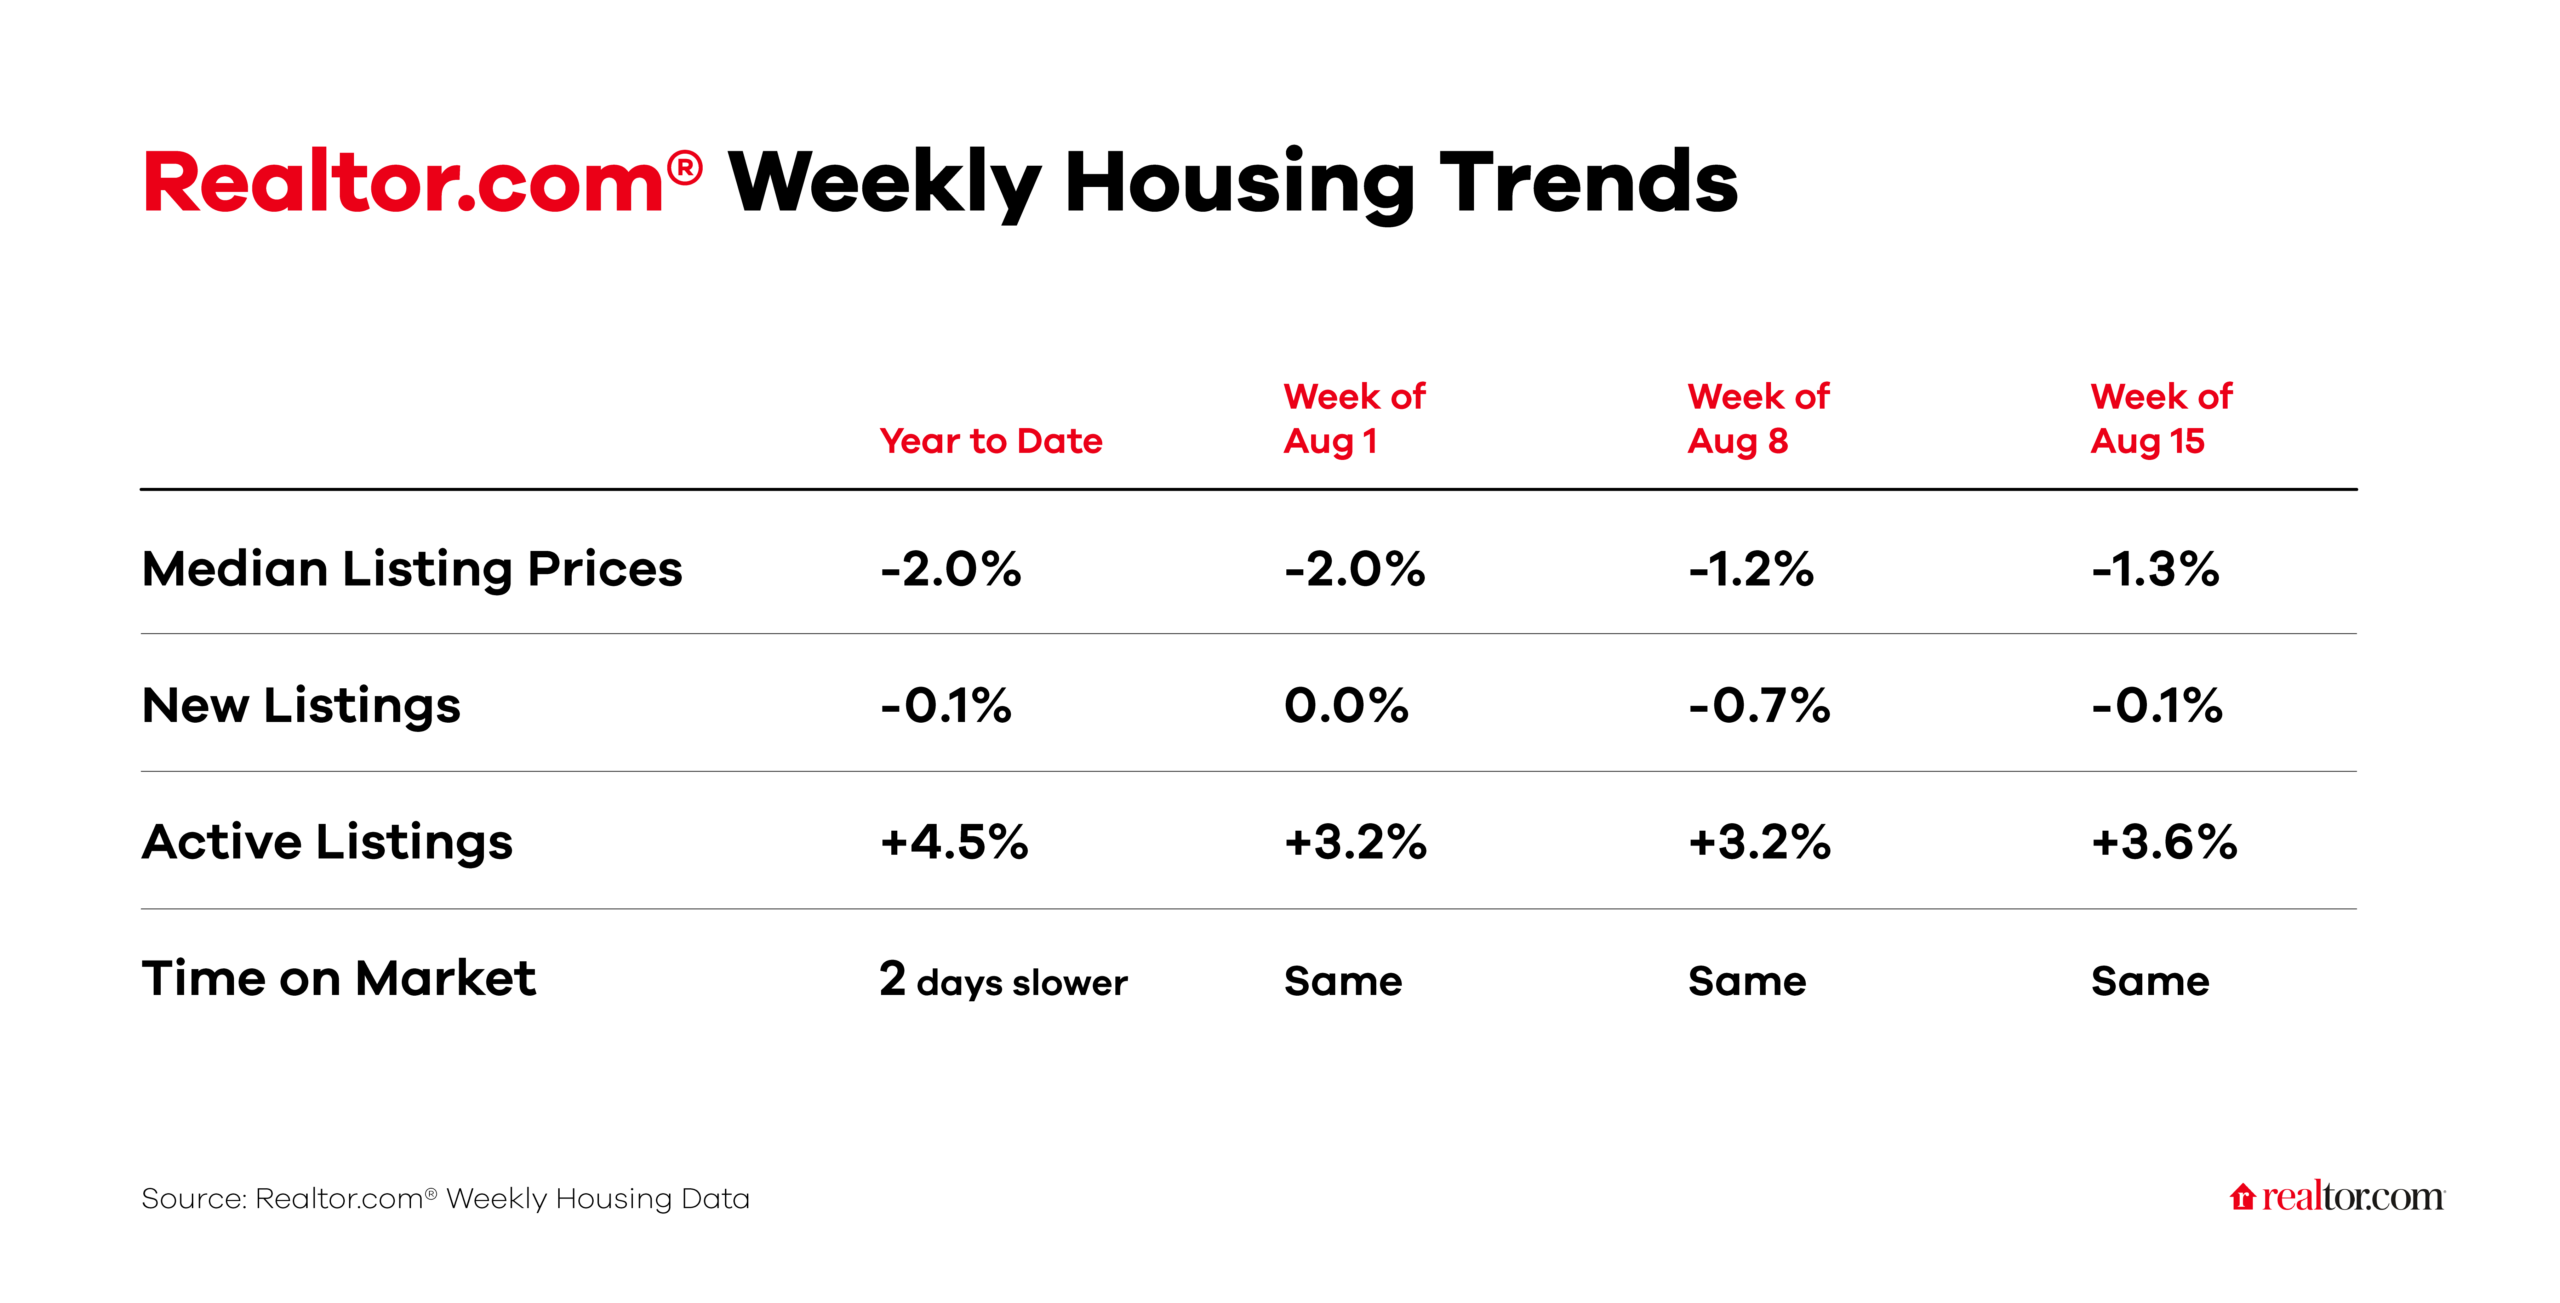
This week, prices continued to decline on a year-over-year basis. As summer progresses, whether this signals market weakness from softer demand or simply reflects sellers pricing more realistically from the start, as seen through much of 2026, remains something to watch. Supporting the latter, the recent Housing Alignment Report shows that while median listing prices have been declining, the median price across views has held steady, suggesting that buyers remaining active represent a well-qualified pool.
Meanwhile, active inventory climbed to its highest level since late 2019, giving buyers more options to choose from, though the share of lower-priced homes has become a smaller part of today’s housing market. New listings have retreated for two consecutive weeks on a year-over-year basis, and with mortgage rates remaining elevated, new sellers may feel hesitation about entering the market.
Active inventory climbed 3.6% year over year
Homes for sale accelerated again.The number of active inventory kept climbing toward 1.2 million this week, the highest level since November 2019. It’s the clearest sign yet that the market has worked through the pandemic-era inventory shortage, but are still well below the pre-pandemic norms. In addition, the composition of that inventory has shifted. The share of homes priced below $370,000 has declined from nearly 50% in 2021 to 42.2% in 2026, according to the Realtor.com 2026 Housing Alignment Report, a sign that lower-tier homes are becoming a smaller piece of today’s market.
The median listing price fell 1.3% year over year
The median listing price declined to $424,500 this week, while price per square foot held steady at $224, the lowest level since spring. Listing prices have now fallen on a year-over-year basis for 31 consecutive weeks. On the buyer side, the median price across views held in line with a year ago, suggesting that buyers remaining active in the market represent an increasingly financially qualified pool, with solid budgets and a clear sense of what they can afford.
Homes spent the same time on the market as they did a year ago
Median days on market held flat in absolute terms, still its highest mark since February and in line with the usual seasonal slowdown. The more notable pattern: this is the twelfth straight week homes have sold at the same pace or faster than a year earlier, a streak that began in late May. Before that, every week back through late 2024 showed slower-than-year-ago selling, some by over a week. That pattern has now fully reversed.
New listings, a measure of sellers putting homes up for sale, fell 0.1% year over year
New listings declined again this week, though at a slower pace than the previous week. Meanwhile, mortgage rates remain elevated, which could continue to keep many homeowners feeling locked in, leaving a meaningful share of potential sellers on the sidelines. The year-to-date average stays just below last year’s pace.