
Key takeaways
- El Centro, Yuma, and Lake Havasu City are the sunniest cities in the U.S., seeing nearly cloudless skies for nearly 300 days per year.
- America’s sunniest cities are largely located in the Southwest, in the Sonoran, Mojave, and Chihuahuan Deserts.
- While warm weather has drawn people to the Sun Belt for decades, the sunniest cities in the country can have major climate risks.
Are you craving some vitamin D or looking for a change of scenery? Well, you’re not alone. Since the pandemic, home buyers and remote workers across the U.S. have been moving to sunnier cities in search of warmth and affordability. Cities in the Sun Belt – a region stretching across the southern third of the U.S. – have generally been the most popular destinations, home to plenty of new housing and world-class winter weather.
This trend continued in 2026, even as risks of extreme weather grew, influencing housing markets across the country.
So, if you’re considering a move to a sunnier city but aren’t sure where to look, we’re here to help. Redfin compiled a list of the sunniest cities in the U.S. to help guide your decision. Read on to see which places topped the list, what to consider before packing your bags, and how to find your perfect home.
The sunniest cities in the U.S.
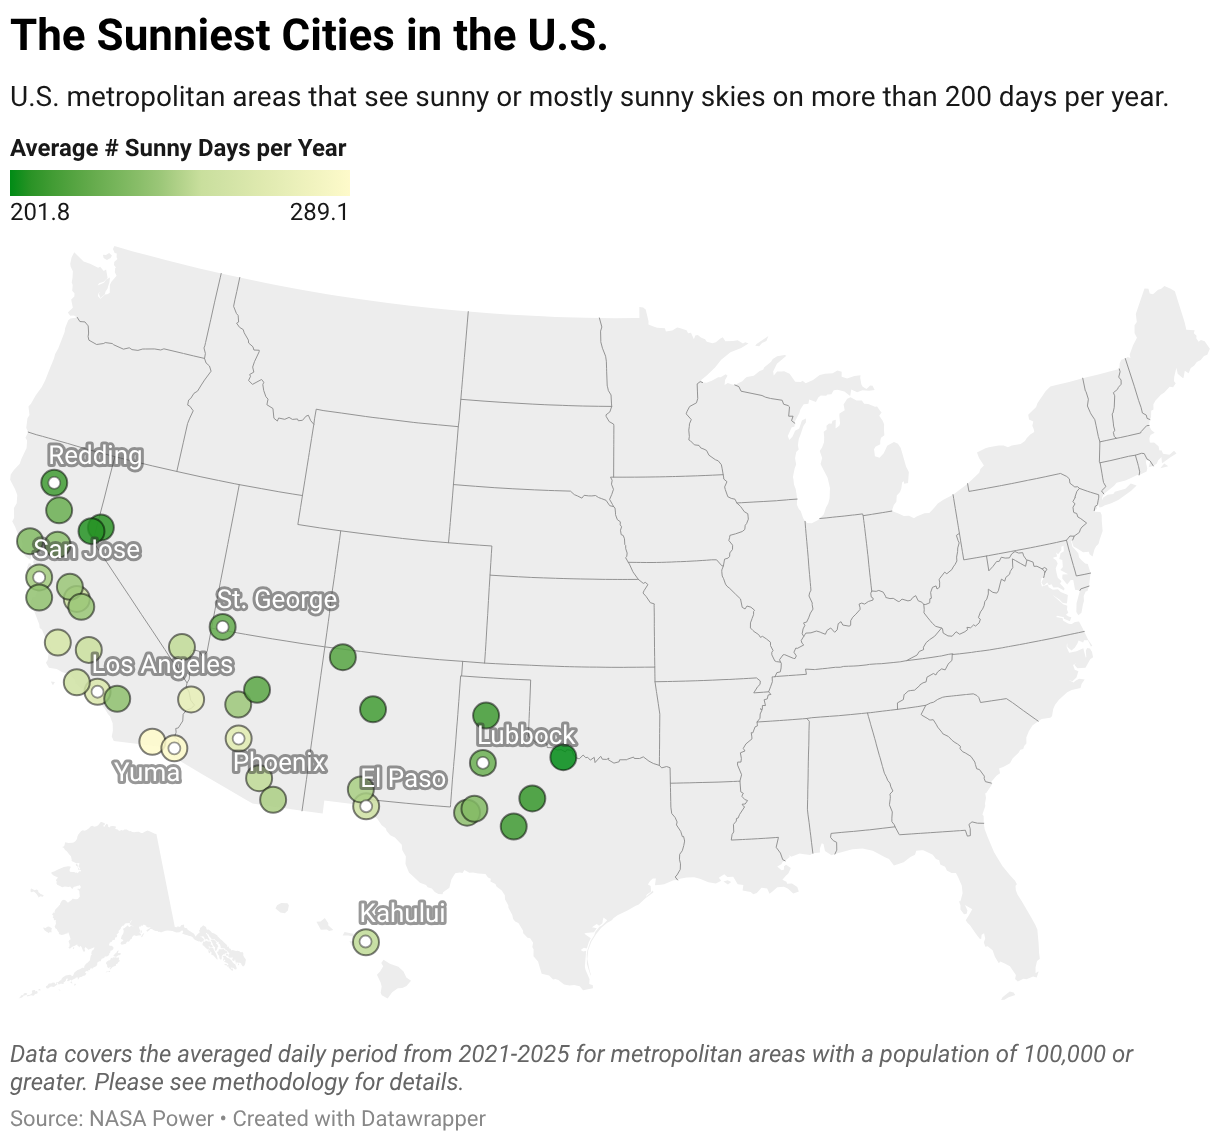
El Centro, Yuma, and Lake Havasu City are the sunniest cities in the U.S., seeing nearly cloudless skies for over 270 days per year. While El Centro sees slightly more clear days, Yuma is the sunnier city by most measures.
Please see the methodology for how we determine a “sunny” day, and what percentage of possible sunshine and solar radiance mean.
| City | Average number of sunny days per year | Percentage of possible sunshine (estimated hours/year) | Solar irradiance (kWh/m²/day) |
| El Centro, CA | 289 | 88% (3,884 hours/year) | 5.93 |
| Yuma, AZ | 288 | 89% (3,947 hours/year) | 5.97 |
| Lake Havasu City, AZ | 272 | 88% (3,910 hours/year) | 5.85 |
| Phoenix, AZ | 269 | 87% (3,876 hours/year) | 5.85 |
| Los Angeles, CA | 264 | 84% (3,704 hours/year) | 5.65 |
| San Luis Obispo, CA | 260 | 82% (3,629 hours/year) | 5.54 |
| Oxnard, CA | 255 | 80% (3,565 hours/year) | 5.51 |
| El Paso, TX | 255 | 86% (3,816 hours/year) | 5.90 |
| Bakersfield, CA | 252 | 82% (3,653 hours/year) | 5.58 |
| Madera, CA | 251 | 83% (3,673 hours/year) | 5.52 |
When measuring by season, desert cities are sunniest from April through June, before the monsoon season begins in late summer. The sunniest cities later in the summer are further north in California, led by Truckee and Chico.
In short: If you want the most overall sunlight and warmth year-round, head to Yuma; if you want one additionally sunny day, head to El Centro.
Why are these cities so sunny?
Nearly all of the sunniest cities in the U.S. are located in the American Southwest, in the hot and dry Sonoran, Mojave, and Chihuahuan Deserts. These places are sunny for two primary reasons:
- They’re located in a subtropical high-pressure zone, which is a phenomenon that occurs at around 30° in latitude both north and south of the equator that helps create many of the globe’s deserts.
- They’re in a rain shadow behind multiple mountain ranges.
Let’s break down a few notable cities to understand their climates.
Yuma is commonly cited as the sunniest city in the world. It receives over 4,000 hours of sunlight per year, according to the World Meteorological Organization, more than desert cities in Egypt and Namibia. According to our estimates using recent NASA data, Yuma sees sunlight for about 89% of all daylight hours (~3,950 hours) – a lower value, but still the highest in the nation and likely the world if we expanded the same measurement globally. Yuma’s hot, dry, sunny climate has helped it become an agricultural leader for sun-hungry crops like lettuce.
El Centro, in California’s fertile Imperial Valley, has a largely identical climate to Yuma, although it’s a bit drier. El Paso is the only city on the list located in the Chihuahua Desert, which helps it see many of the same patterns as Yuma and Phoenix.
Lastly, Oxnard has some of the best weather in the country, home to a sunny and cool Mediterranean climate. It sees completely clear skies for nearly a third of the year, never gets too hot or too cold, and has very low humidity. Nearby Los Angeles and San Luis Obispo have similar climates. All three cities are among the most expensive places to live in the U.S., though.
Why sunshine matters when choosing where to live
Sunny weather is undeniably pleasant when it’s not too hot. It can make spending time outdoors easier, encourage an active lifestyle, and boost your mood. This is one reason why cities across the Sun Belt have been attracting new residents recently.
The Sun Belt has actually been a popular spot for home buyers for over 60 years, helping cities in the region grow rapidly over the time. People have long been attracted to new economic opportunities and growing communities.
However, that popularity has come at a cost. The pandemic-era migration boom sent home prices soaring in many Sun Belt cities, pricing out local buyers and making once-affordable markets increasingly expensive. Now, as demand cools, prices are falling in some of those same cities, giving buyers more negotiating power.
But lower home prices don’t necessarily mean lower housing costs. Rising insurance premiums and HOA fees, especially in Florida, are adding thousands to the cost of homeownership, while climate risks like extreme heat, hurricanes, and flooding are pushing some residents out. Before relocating somewhere sunny, it’s worth looking beyond the surface and weighing the full cost of living there.
If you’re looking to move, you can explore how much sunlight an individual property gets directly on Redfin.com. Simply click on any home to see its typical daily sunshine hours, or explore a simulated 3D model for a more detailed look at sun exposure throughout the day. You can also check a property’s climate risks, average monthly temperature and precipitation, and more. Redfin partners with Shadowmap, the Weather Company, and First Street (now owned by MSCI) to display this data for nearly every property in the U.S.
>> Read: Where Should I Live? 10 Questions to Help You Decide
Methodology
Sunniness is typically divided into three categories: sunny, mostly sunny, and partly sunny. Sunlight is only measured from sunrise to sunset.
- Sunny: less than 1/8th of the sky is covered with clouds
- Mostly sunny: 1/8-3/8ths of the sky is covered with clouds
- Partly sunny: 4/8-5/8ths of the sky is covered with clouds
To determine the “sunniest” cities, we ranked U.S. metropolitan areas (“cities”) with populations over 100,000 based on their combined average annual number of “sunny” and “mostly sunny” days.
We also included each metropolitan area’s percent of possible sunshine and solar irradiance, though these didn’t factor into the rankings.
- The percent of possible sunshine is calculated by dividing the estimated minutes of recorded sunshine that reaches the ground by the total possible sunshine minutes from sunrise to sunset. We estimated this by combining NASA’s monthly clearness index and the Angstrom–Prescott relation with standard FAO-56 coefficients, combined across 12 months and weighted by daylight hours.
- Solar irradiance (“solar energy”) measures the strength of the sunlight that reaches the ground in kWh/m²/day, indicating how strong the sun is. Places further from the equator will generally see lower values because the sun sits lower in the sky.
All data comes from NASA Power from 2001-2025 into a total or average monthly value. NASA Power measures global atmospheric conditions using satellite-derived data on a 1° x 1° grid (roughly 110km x 85km). Due to its breadth, metros that were closer to each other sometimes received identical values. When this happened, we grouped them together under the largest one.