

October 19, 2026
Reports and articles referenced:
Featured Report
What’s Ahead
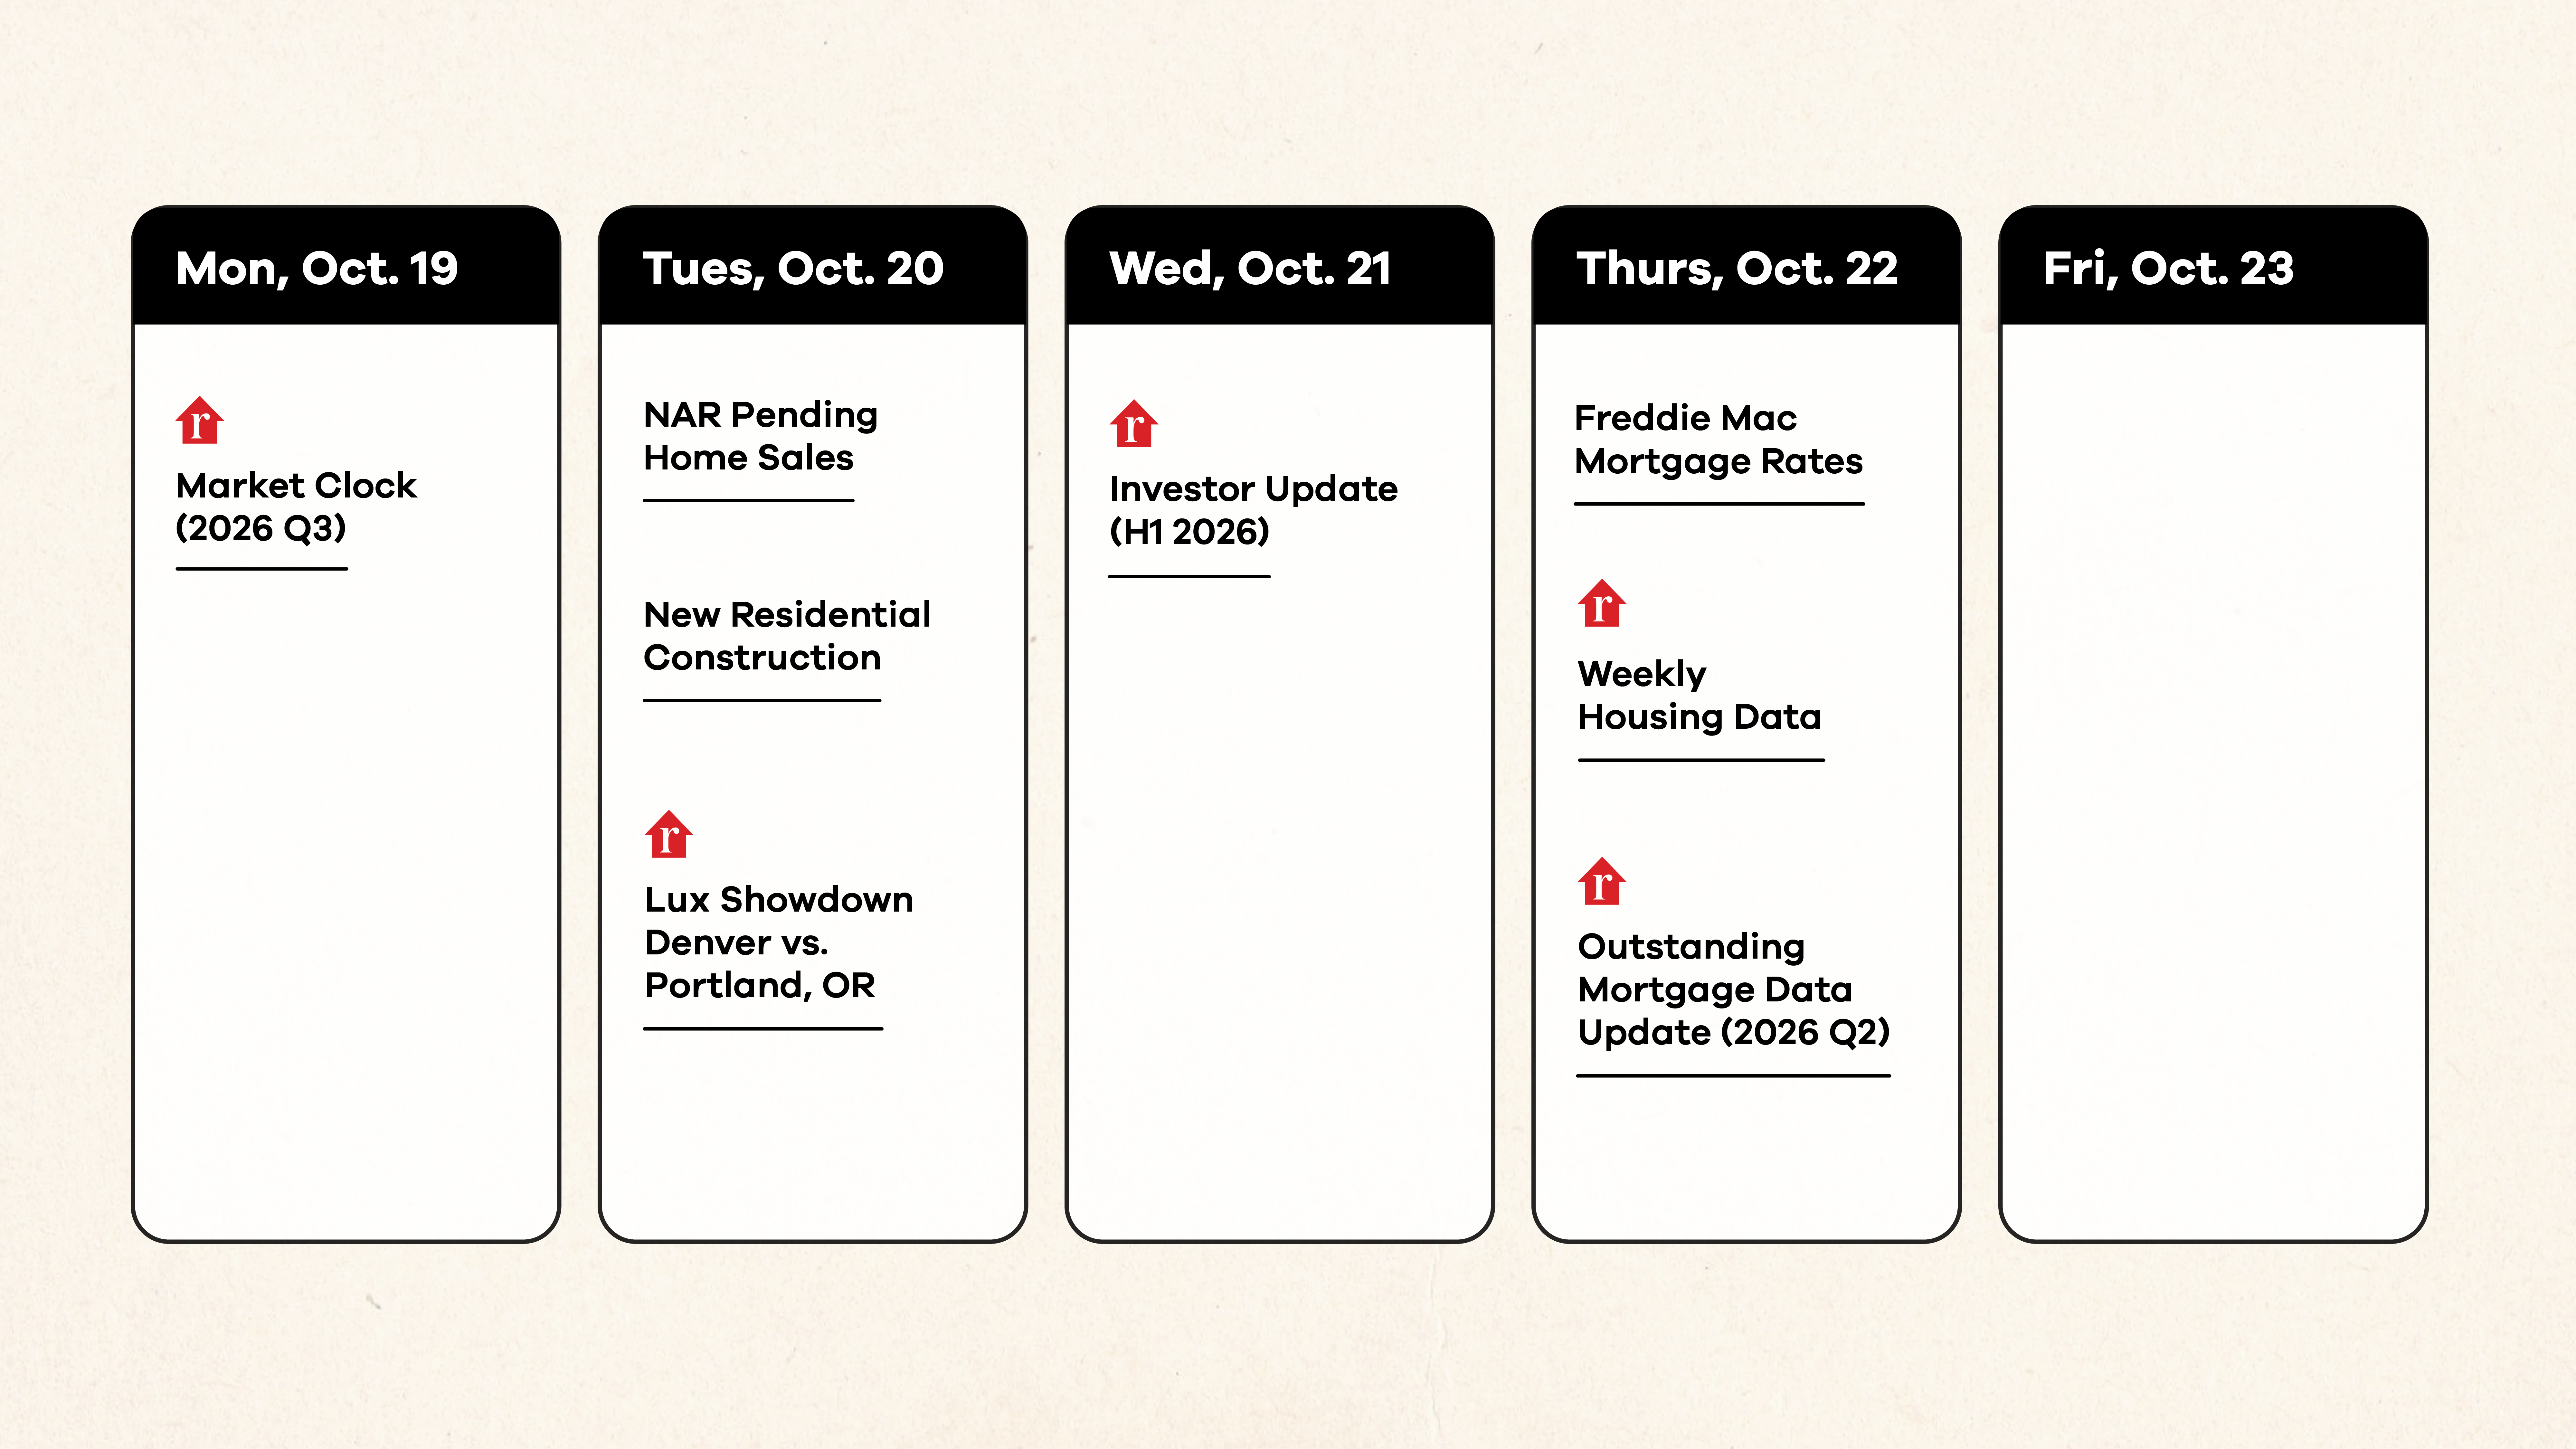
Upcoming Realtor.com Economics Reports:
- Monday, October 19 Market Clock – 2026 Q3 Report
- Tuesday, October 20 Luxury Showdown – Denver vs. Portland, OR
- Wednesday, October 21 Investor Report – 2026 H1
- Thursday, October 22 Weekly Housing Data
- Thursday, October 22 Outstanding Mortgage Data Update – 2026Q2
Recent Indicators
Housing data for download:
Video Script:
-
Introduction:
- The housing market is shifting. Whether you’re a buyer or seller, you’ve probably sensed that change. Today I’ll dig into the latest reading from one of the tools we use to measure what’s going on and whether buyers or sellers are likely to have the upper hand in negotiations.
- I’m Danielle Hale, Chief Economist at Realtor.com, and this is The Weekly Housing Outlook your guide to the best research and insights on the economy and housing market and what they mean for renters, buyers, sellers, and industry pros.
Featured Report
-
- Today’s feature is our latest Market Clock report. The Realtor.com Market Clock tool helps people identify whether buyers or sellers have the negotiating power in a market based on trends in inventory, or the supply of homes for sale, and transaction activity, our proxy for housing demand. The tool is framed as a clock where 12 o’clock represents peak seller market power and 6 o’clock peak buyer market power. Senior Economist Jake Krimmel has more on the tool in a video linked below.
- This third quarter we introduce a revamped methodology that improves the clock’s recency, so the just-issued report describes the September housing market. The national housing market is now in the late balanced position and at 4 o’clock is trending toward buyers, suggesting that nationwide, buyers are gaining more negotiating power. That finding is consistent with our September housing data showing that more than 1 in 5 listings had a price cut in the month, a record high for this time of the year.
- Digging below the national level, the market clock shows that conditions vary across the 100 largest markets with 10 different times on the clock represented. There are large clusters of 26 markets each at 1 and 4 o’clock. 1 o’clock is a late seller’s market, just before tipping into more balanced conditions, while 4 o’clock is a late balanced market, on the cusp of becoming a buyer’s market.
- Regionally, the South is home to the most buyers markets, both outright and proportionally. Conditions in the Midwest still favor sellers.
- In the last quarter, as mortgage rates climbed, 41 of 99 markets changed time, with nearly all of the biggest moves coming in a buyer-friendly direction. This underscores one of the complicating factors for today’s buyers. Mortgage rates above 7% have curtailed purchasing power and cut into affordability. This is partly driving the shift in market balance, and also a reason why we may not yet see buyers take advantage of their improved market position. For now, cash buyers and those with large down payments who are less reliant on financing are in a good position to take advantage of the shift in momentum.
-
The Week Ahead:
- Now let’s turn to the week ahead, and the Realtor.com Economics team reports and market indicators to watch out for this week.
- In addition to today’s Market Clock report from Senior Economist Jake Krimmel, on Tuesday Senior Economist Anthony Smith publishes a luxury market showdown featuring two areas known for their outdoorsy lifestyles: Denver, Colorado and Portland, Oregon. On Wednesday, Senior Economist Hannah Jones publishes her latest review of trends in the investor market. On Thursday, Hannah is back with an analysis of data on outstanding mortgages that will examine the lock-in effect and how it is likely to unfold over the next year, and Senior Economist Anthony Smith reviews what the latest housing data say about the market in our Weekly Trends report.
- There are a few key metrics to watch this week including Pending Home Sales and new construction indicators on Tuesday and Freddie Mac’s mortgage rate data on Thursday.
- Pending home sales, published by the National Association of Realtors, measure contract signings, which are when both a buyer and seller have agreed to the terms of a sale. Pending home sales are an early indicator for closings in the next month or two, as typically contract periods are generally in the 30-60 day range. I’m anticipating a weaker reading for these September pending home sales. In September, Realtor.com data showed that pending home sales weakened from the prior year as mortgage rates increased. It’s worth noting that slightly different methodologies mean that indicators from Realtor.com and NAR can sometimes differ. Last week’s existing-home sales data did manage to hold onto some month-to-month momentum, which we may see in this week’s pending-home sales, but they are very likely to be weaker than at this time in 2025.
- New construction data is likely to be flat for the month which should mean decent growth from last year. Single-family starts, in particular, were quite low last year. Multi-family starts have been far noisier and harder to predict. In the permit data, I’m watching for a 3rd straight month of yearly growth in single-family permits.
- This week’s Freddie Mac mortgage rate data will be interesting. Last week mortgage rates were flat. Late in the week, the 10-year yield dropped out of the 5.2% to 5.3% range it had held since late September which, if it holds, will mean some mortgage rate relief this week.
- Mortgage rate relief is welcome for those hoping to take advantage of the seasonal sweet spot. Nationally, the ‘best time to buy’ was in early October, but last week conditions were prime in 5 markets spread from coast to coast including San Francisco, California and the nation’s capital, Washington, DC. This week, just 4 markets with a wide geographic range see peak conditions, namely, Birmingham, Cleveland, San Jose, and Seattle. Next week is the last major week of the best time to buy season when 8 markets see optimal conditions.
The Weekly Review:
-
- Now let’s look back at the major updates and research that were released last week.
- We saw existing-home sales data from the National Association of Realtors. Last week I anticipated both a monthly and yearly decline, but we actually saw a bounce higher from August to September. This is somewhat tempered by a downward revision to the August data.
- Existing-home sales remained below a 4 million pace for the second time in the last 14 months as mortgage rates weighed on buyers, and this drag is likely to worsen a bit in the months ahead before it improves. Home sales prices rose modestly from last year even as Realtor.com asking prices continued to soften. Importantly, a slower sales pace enabled first-time homebuyers to build on the increased momentum from last month. In September first-time purchasers were 31% of sales, up from 30% the prior month and prior year.
- Another important indicator last week was the consumer price index or CPI–which measures inflation. Headline inflation and core inflation were both up in September, and both increased somewhat more than expected. This raised odds of a Fed rate hike in October, but the baseline case is still that the Fed leaves rates unchanged in October, hiking again in December. As Senior Economist Jake Krimmel noted, “A hold is hardly the slam dunk it was,” before this CPI reading.
- Usually, when inflation comes in hot, mortgage rates increase, but this week mortgage rates held steady at 7.40%, right in line with last week’s highs. Despite still-high rates, Senior Economist Jiayi Xu noted that “Buyers who stay engaged may find footing in a market where motivated sellers are increasingly willing to negotiate,” citing Realtor.com price cut and delisting data as evidence.
- Analyzing weekly housing data from Realtor.com, Senior Economist Anthony Smith found an uptick in listings growth despite another soft week for new listings, noting that, “Inventory has been building momentum throughout the fall, rising from roughly 4% year-over-year growth in late August to nearly 7% now.” Asking prices remain soft as time on market is in line with what we saw at this time last year.
- Of course even as the national market remains soft, some areas are outperforming. The Northeast and Midwest continued to dominate the list of fast-moving, in-demand areas that topped our September Hottest Markets report by Senior Economist Hannah Jones. Areas around Chicago, New York, and Boston are particularly well-represented as they enable access to high-wage jobs at a much lower housing cost. The list of large markets seeing big shifts in their hotness rank is dominated by the West with Jacksonville, FL in the South coming in at number one.
- Also last week, Realtor.com Economics published our monthly luxury report in which Anthony Smith found that asking price softness is apparent in the luxury tier as well with high-end homes dropping between 3 and 5% in price. With school in full swing, Anthony also examined the markets where luxury listings are located near stop scoring schools. Florida is well represented among the list with luxury homes in both Naples-Marco Island and Crestview-Fort Walton Beach-Destin, Florida scoring more than 9 out of 10 to top the list.
- Finally, Senior Economist Jiayi Xu recently examined rental trends finding that although national rents logged a 38th straight month of decline in September, the pace is slowing. September’s rent dip was the smallest in 3 years. Beyond the headline figure, Jiayi examined the markets where rent trends have shifted the most in the last year. Across all markets, the big shifts have been in a positive direction as either cooling supply growth, demand increases from renters seeking affordability, or AI growth have either slowed or stopped rent declines and in the San Francisco and San Jose, California markets, in particular, pushed rent growth even higher.
Questions from the Mailbag:
From Reddit
-
- Q: Do you feel like the COLA hike is meeting the moment/needs of older homeowners?
- A: This is a question that one of our reporters recently dug into. Allaire Conte covered the Social Security Administration’s announced Cost of Living Adjustment or COLA for 2027 and dug into the details behind how the numbers are calculated. By law, Social Security is adjusted to match the increase in the CPI-W, an inflation measure that tracks prices among urban wage earners and clerical workers that was the only series that existed in 1975 when inflation adjustments began. This year the increase will be 3.6%, but as Allaire covers, several housing-related costs from insurance to property taxes, have risen faster than cost of living adjustments in recent years. The good news for homeowners living on a fixed income, and there are likely many of them given that Boomers and older generations currently own more than 36 million homes, is that many states offer property tax breaks to older Americans. Allaire has also reported on this. If you’re in one of these areas, be sure to take advantage.
-
- That’s it for this Weekly Housing Outlook! What does the Market Clock say about your housing market and how will that shift your strategy as a buyer or seller? Let me know in the comments below, or on your preferred social channel! You can find all of our research and housing data at Realtor.com/Research, with direct links in the description. Subscribe on YouTube so you never miss a Monday briefing. Thanks for watching and I’ll see you next week!
Subscribe to our mailing list to receive monthly updates and notifications on the latest data and research.