

Our global markets watchlist tracks nine prominent indexes from economies around the world. The list includes the S&P 500 from the United States, TSX from Canada, the FTSE 100 from England, the DAXK from Germany, the CAC 40 from France, the Nikkei 225 from Japan, the Shanghai from China, the Hang Seng from Hong Kong, and the BSE SENSEX from India. For a look at how some emerging markets across the globe stack up against each other, read our emerging markets update.
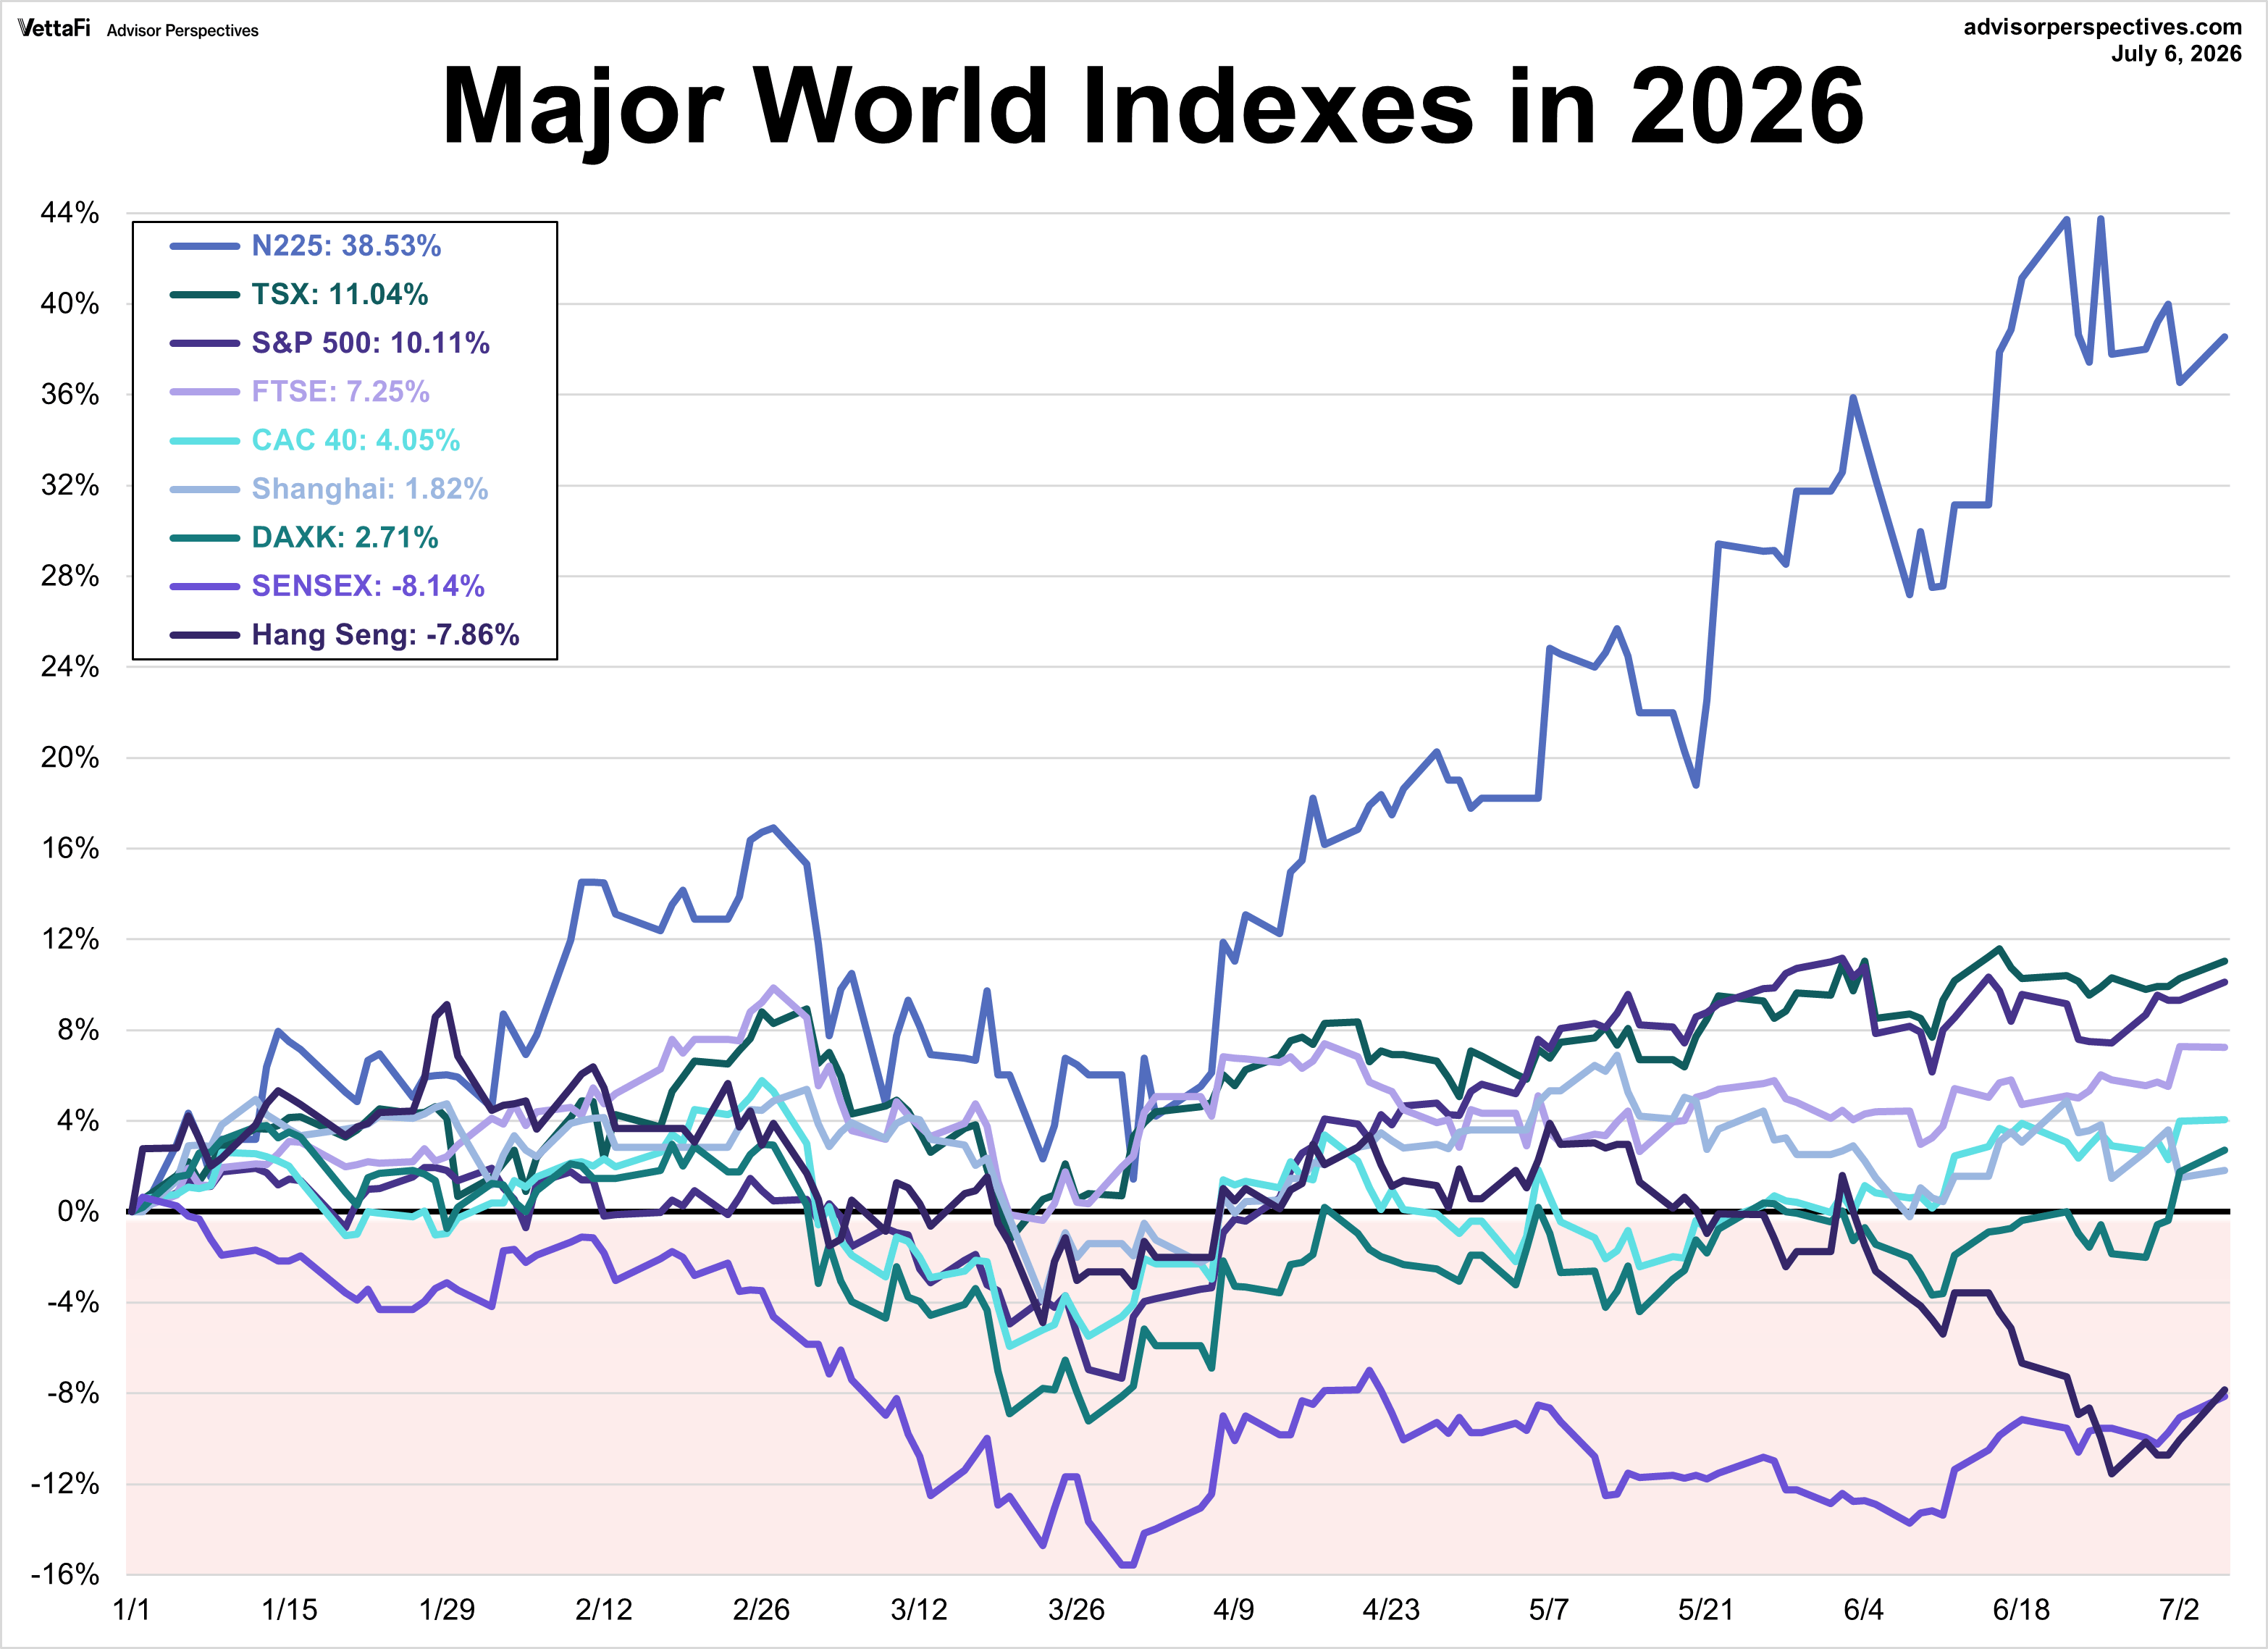
Through July 6, 2026, six of the nine indexes on our watchlist remain in positive territory. Japan’s Nikkei 225 leads the pack with a 38.5% year-to-date gain, followed by the Canada’s TSX (+11.0%) and the U.S.’s S&P 500 (+10.1%). Conversely, India’s BSE SENSEX has struggled the most, down 8.1% for the year followed by Hong Kong’s Hang Seng with a loss of 7.9%.
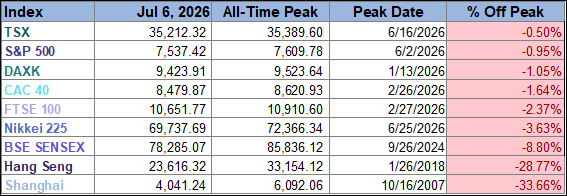
To provide additional context on where these indexes stand relative to their historical peaks, the table below shows each index’s current value, all-time peak, the date of that peak, and how far it is from that record level.
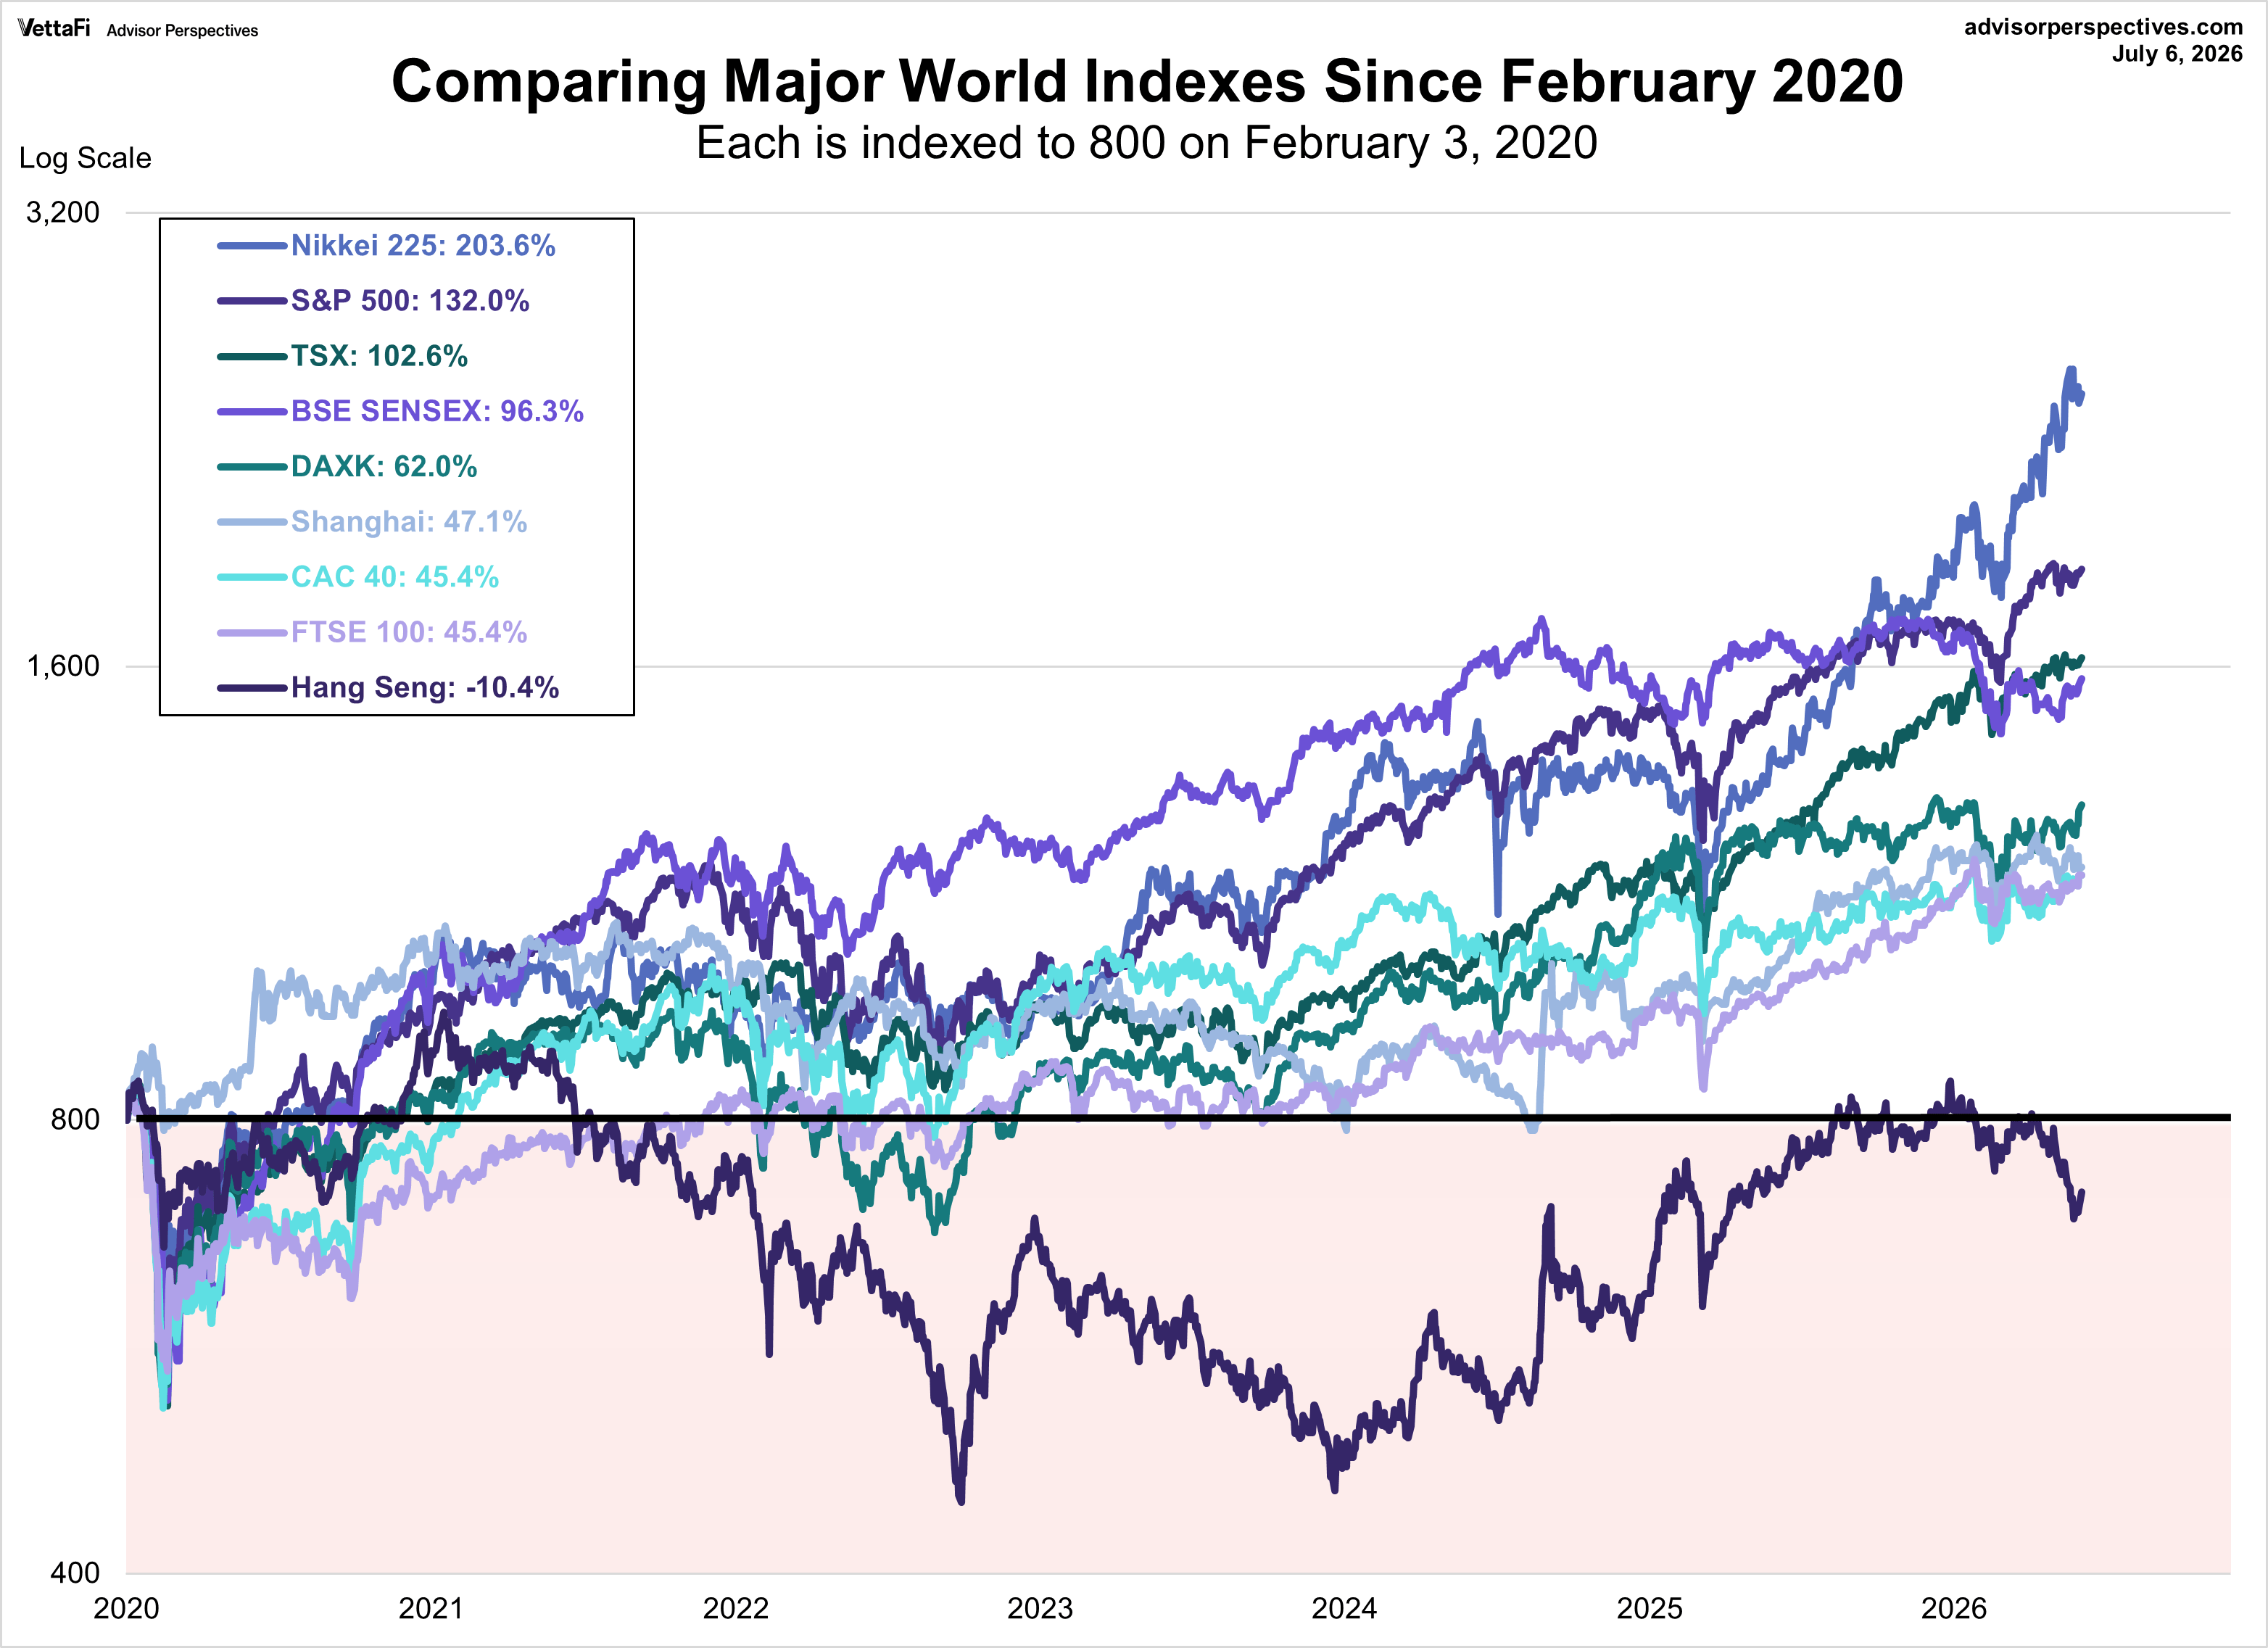
World Indexes and Recent Recessions
Let’s start with a very recent chart with the latest recession. We’ve used February 3, 2020 for our start date (this is the official NBER recession start).
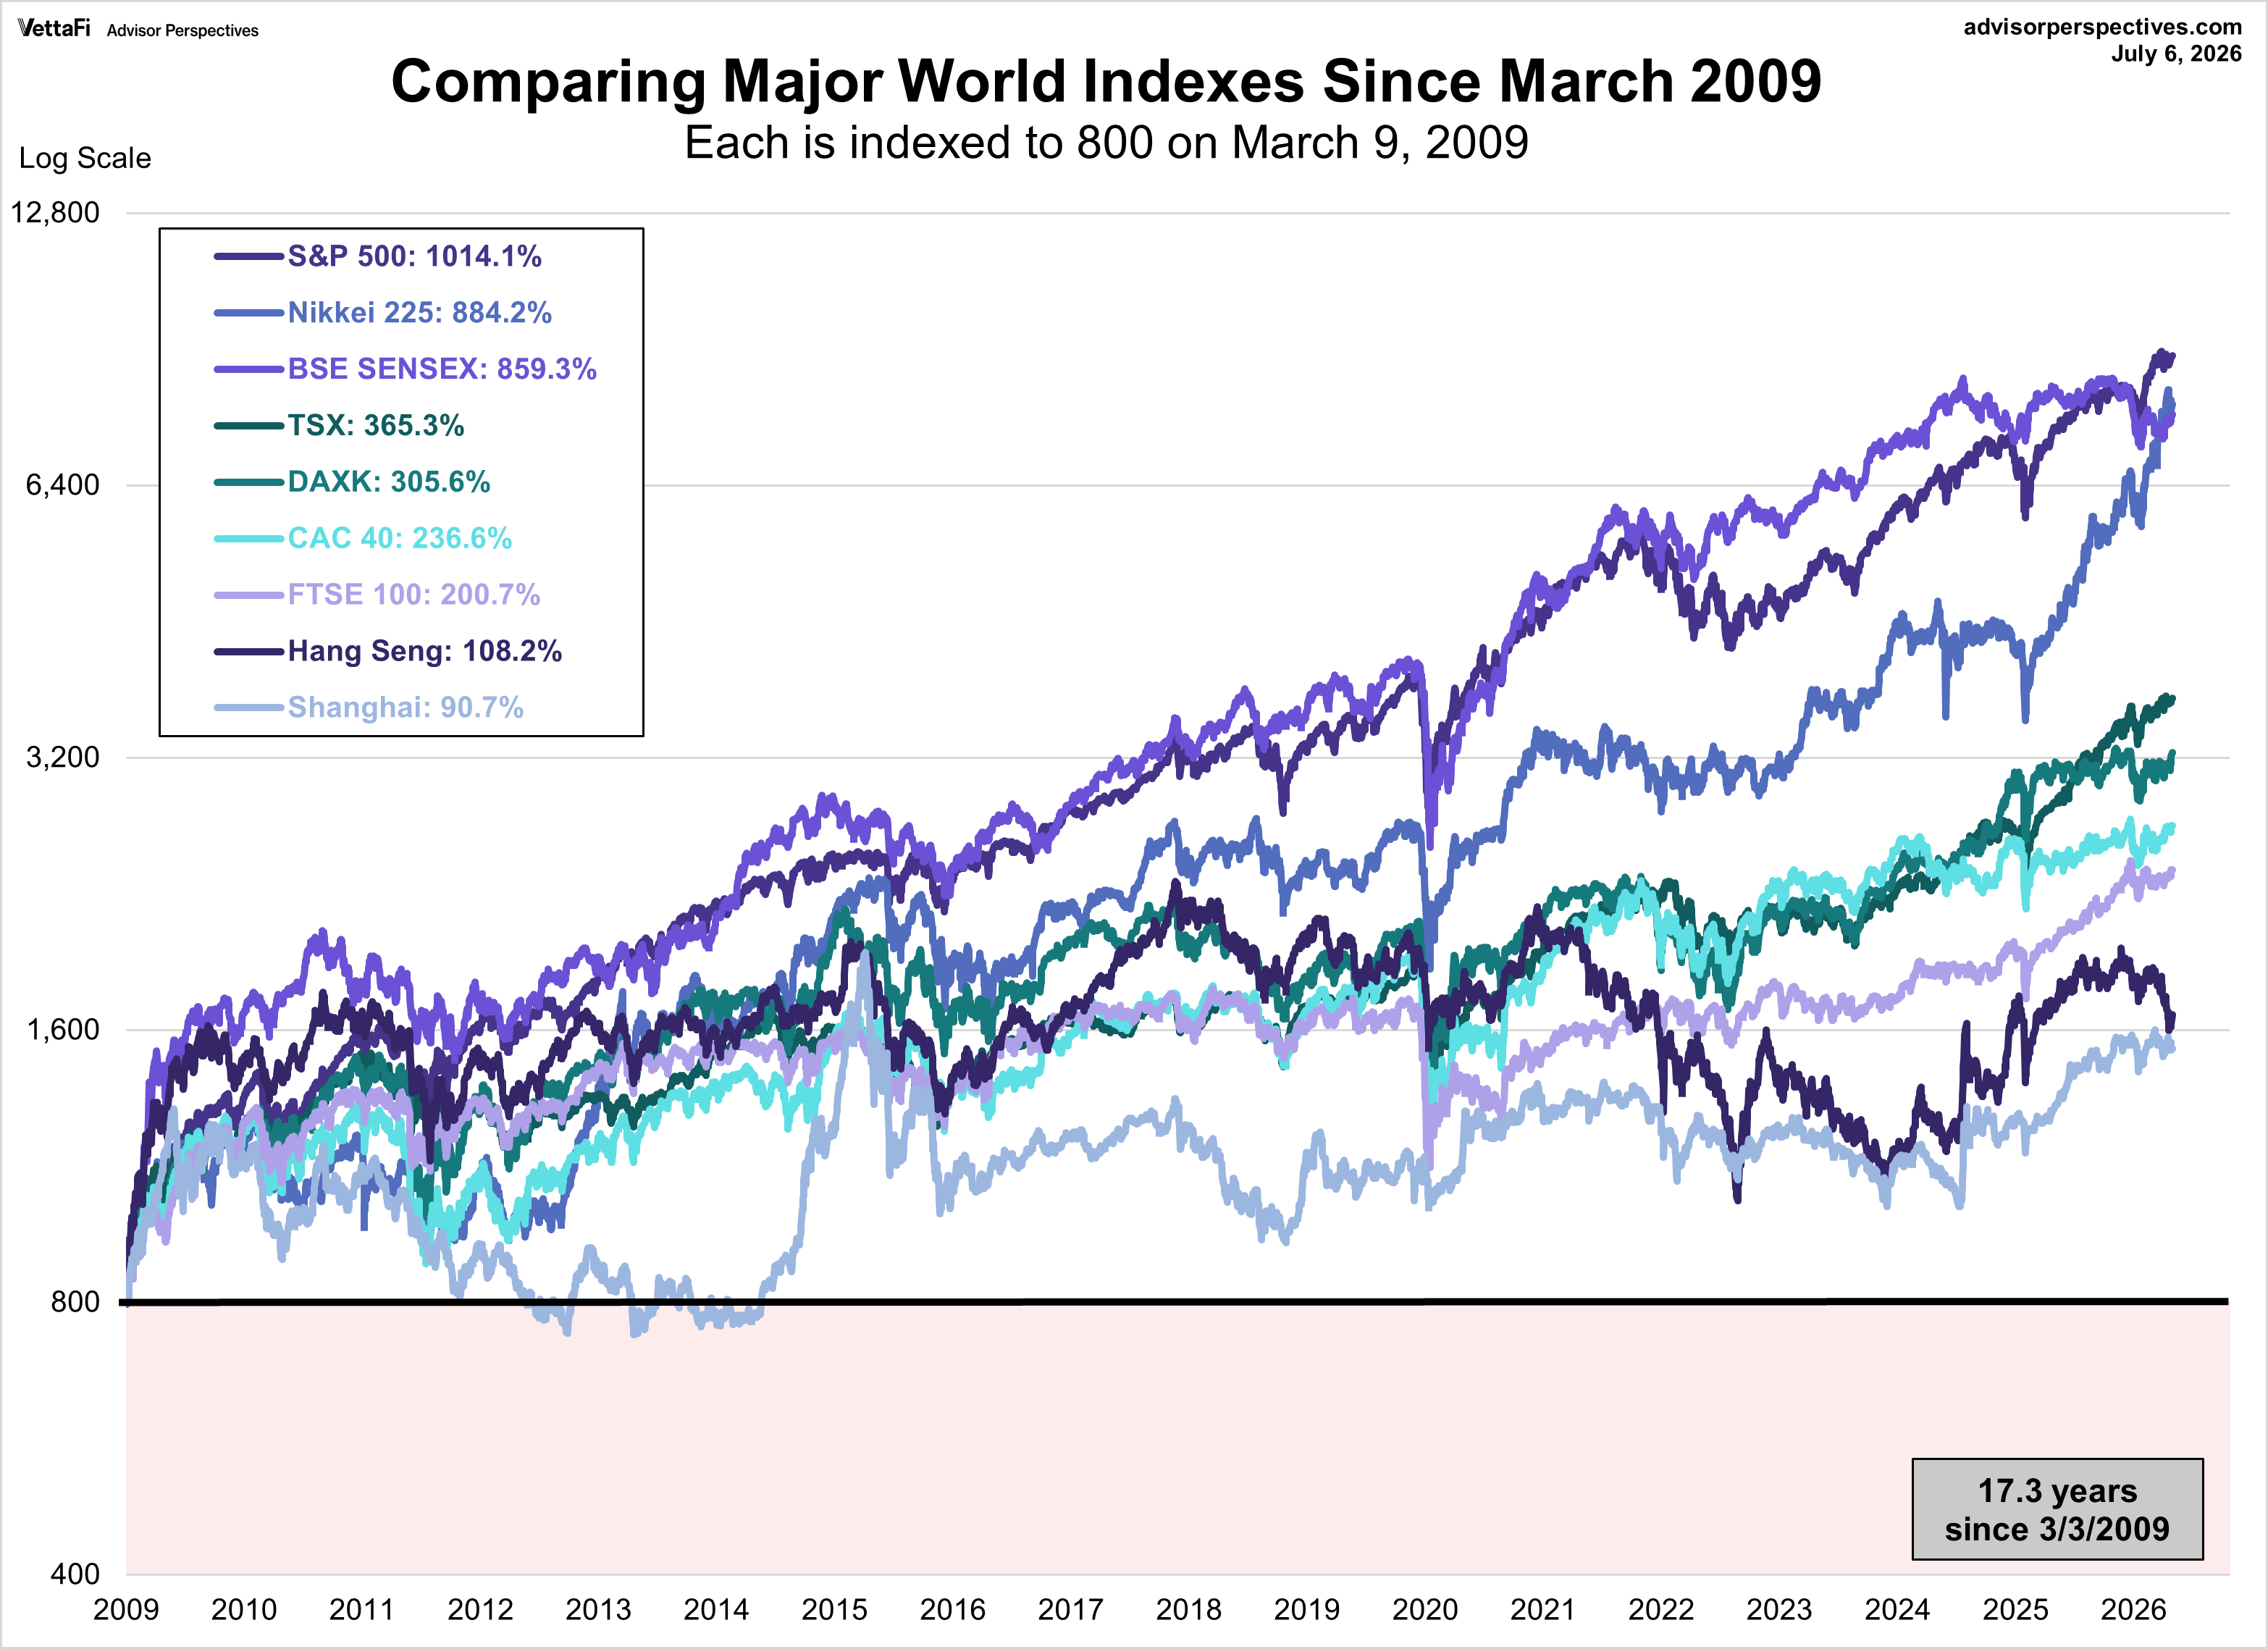
The chart below illustrates the comparative performance of world markets since March 9, 2009. The start date is arbitrary: The S&P 500, TSX, CAC 40 and BSE SENSEX hit their lows on March 9th, the Nikkei 225 on March 10th, the DAXK on March 6th, the FTSE on March 3rd, the Shanghai Composite on November 4, 2008, and the Hang Seng even earlier on October 27, 2008. However, by aligning on the same day and using a log-scale vertical axis, we get an excellent visualization of the relative performance. I’ve indexed each of the eight to 800 on the March 9th start date. The callout in the upper left corner shows the percent change from the start date to the latest weekly close.
Here is the same visualization, this time starting on October 9, 2007, a previous closing high for the S&P 500. This date is also approximately the mid-point of the range of market peaks, which started on June 1st for the CAC 40 and ended on January 8, 2008 for the SENSEX.
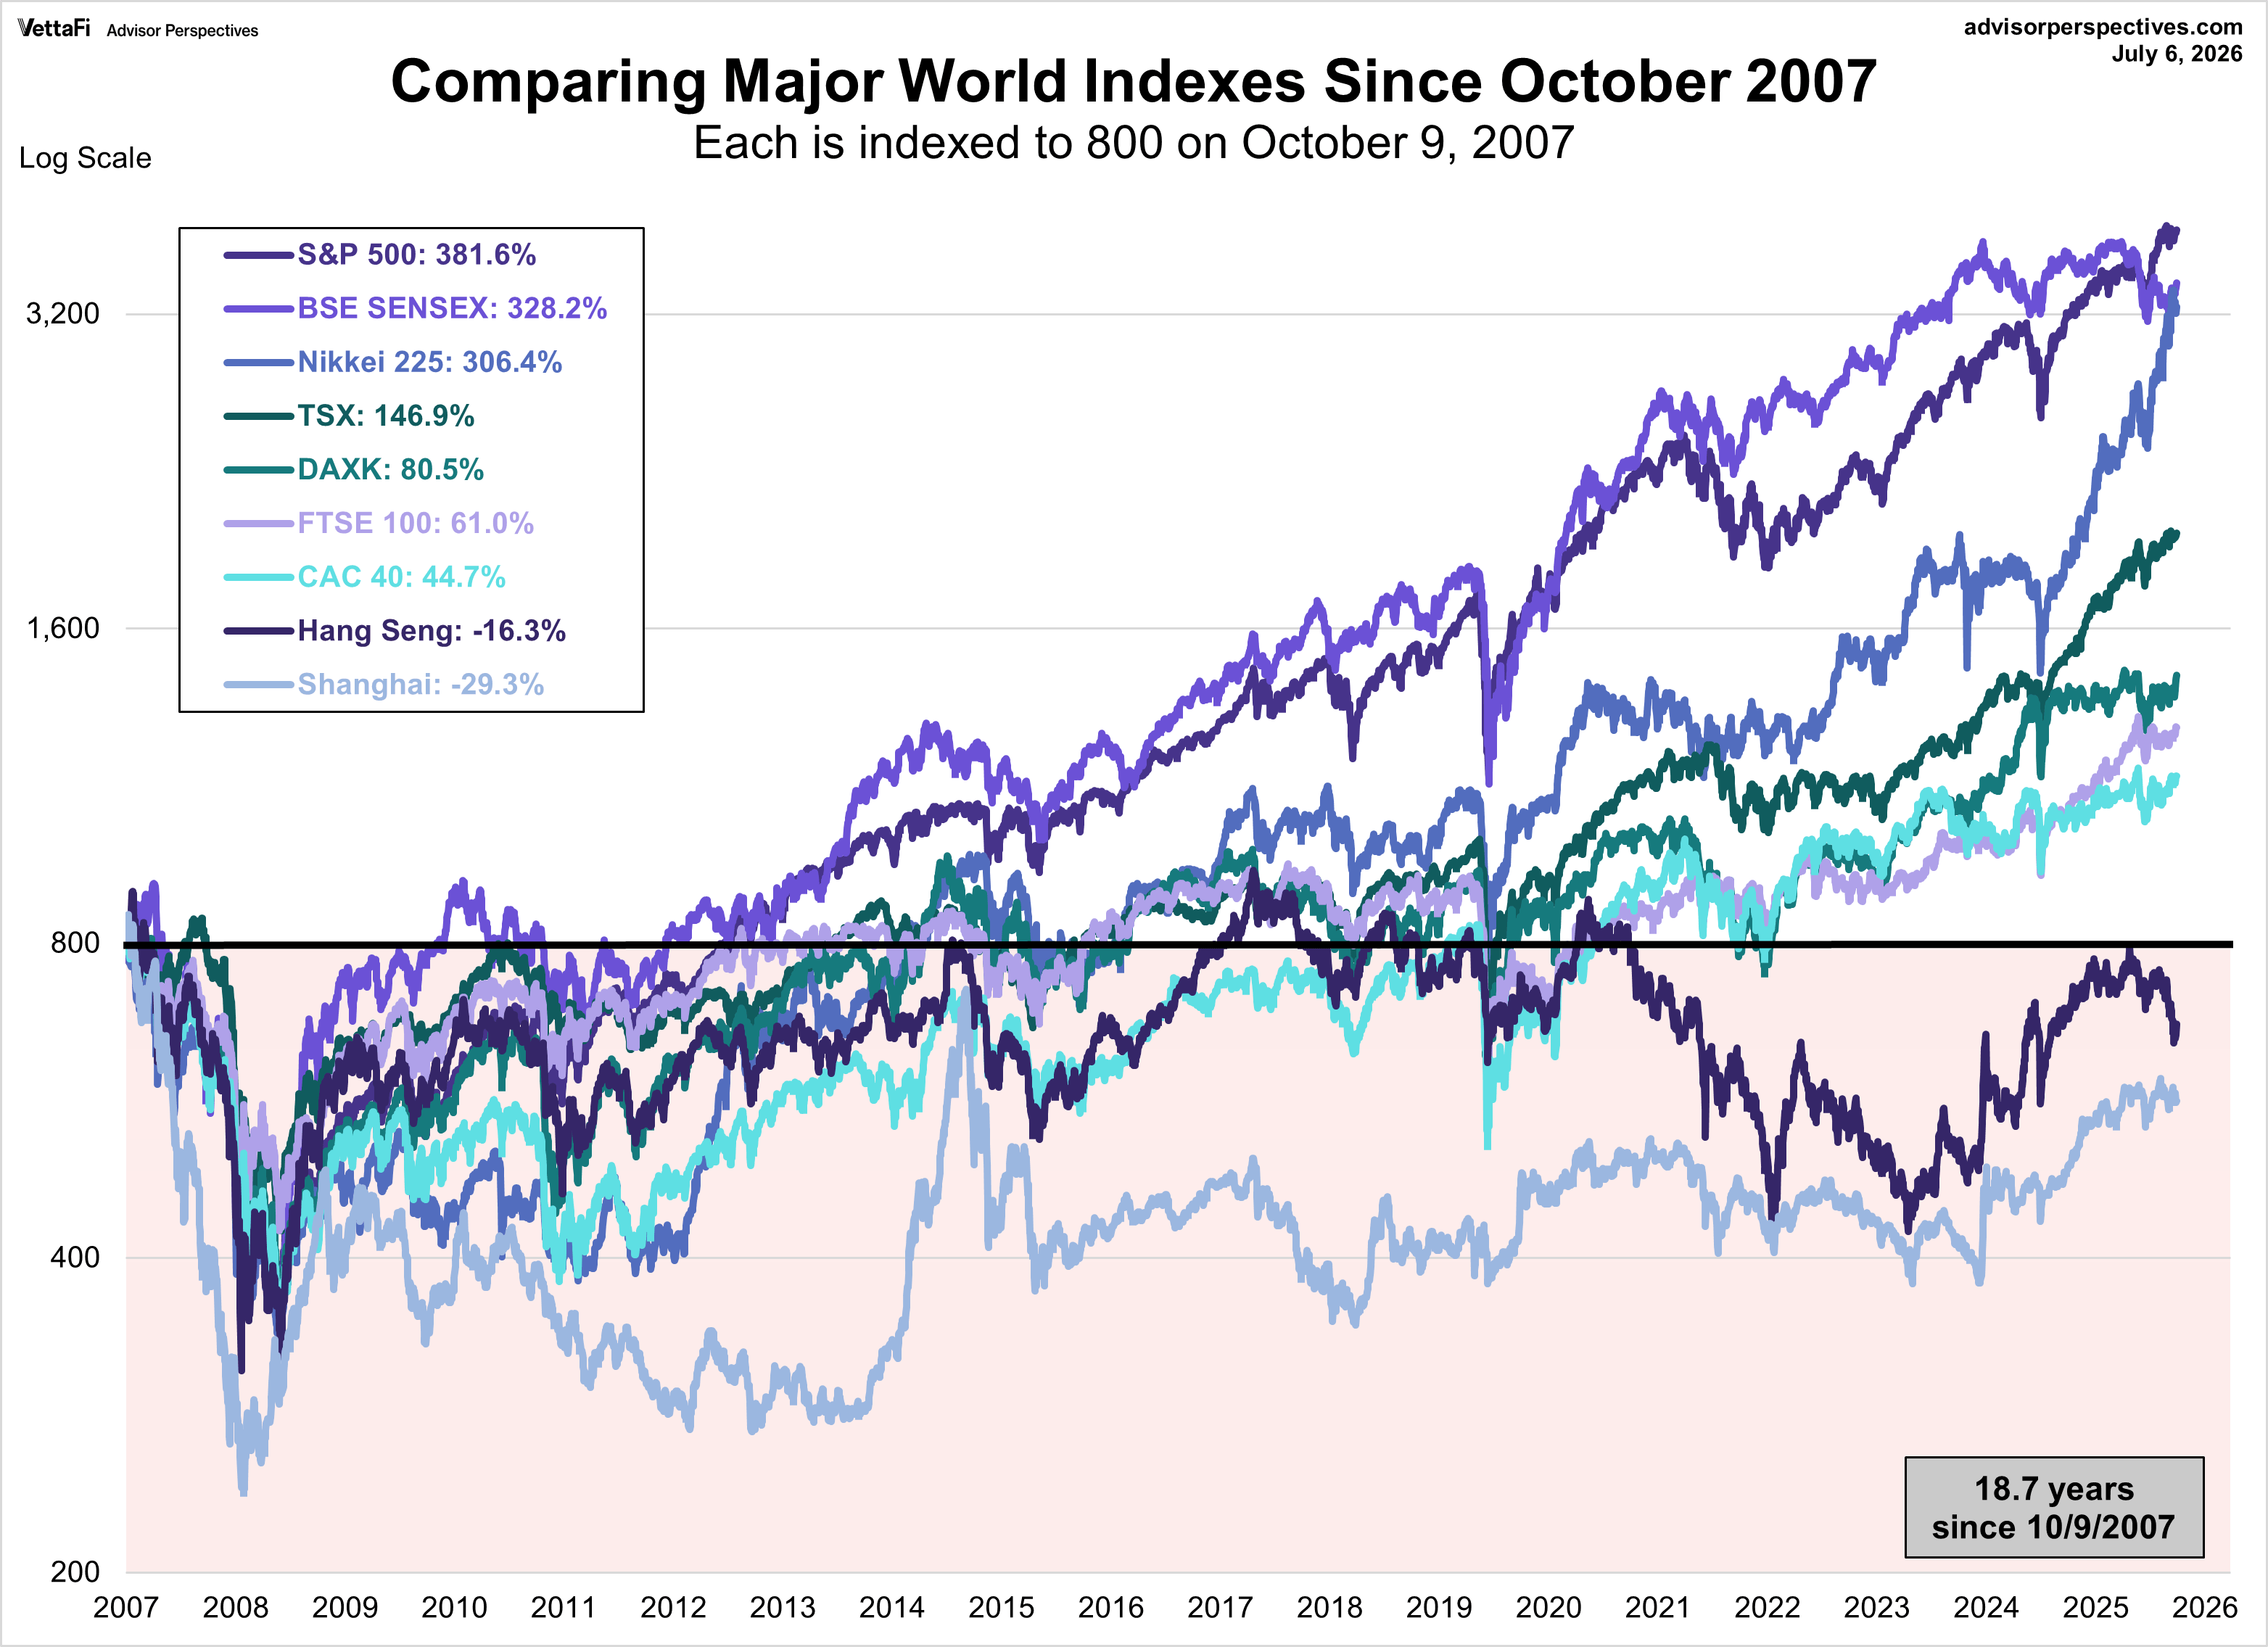
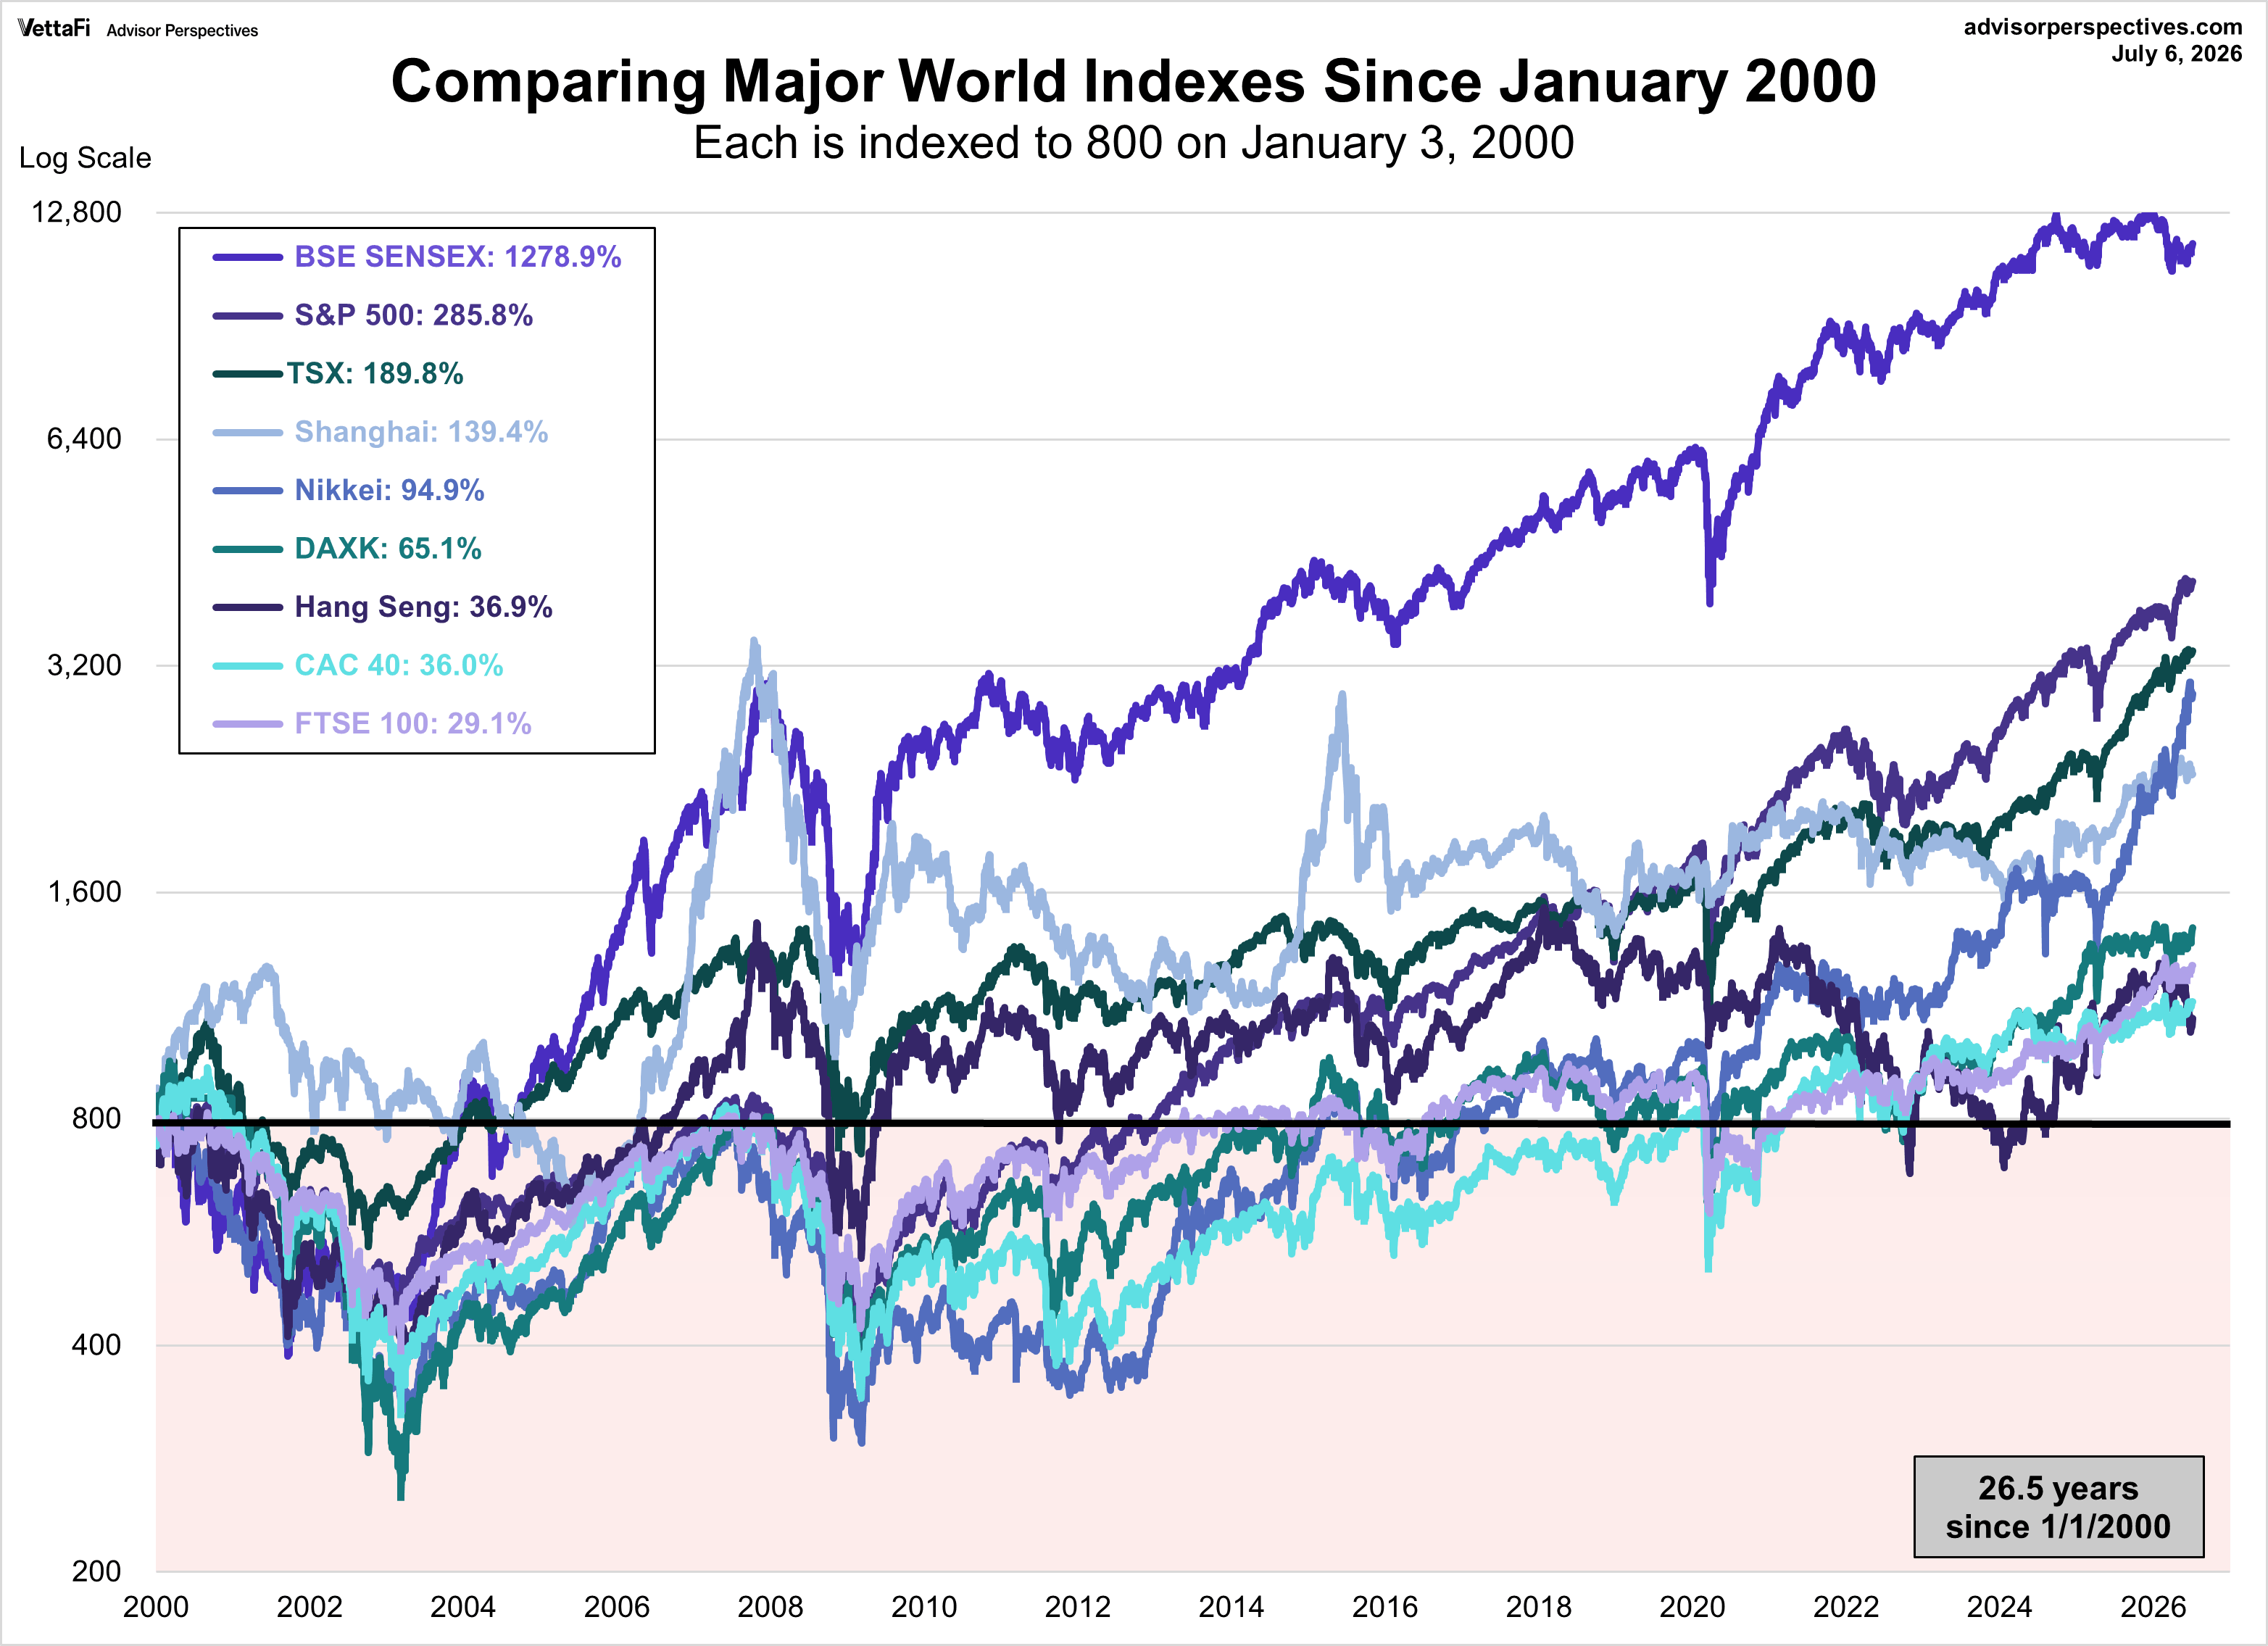
For a longer look at the relative performance, our final chart starts at the turn of the century, again indexing each at 800 for the start date.
Examples of single country ETFs:
Note: I track Germany’s DAXK a price-only index, instead of the more familiar DAX index (which includes dividends), for consistency with the other indexes, which do not include dividends.
Originally published at Advisor Perspectives
For more news, information, and strategy, visit the China Insights Content Hub.