

Welcome to this weekly housing trends update, where we bring you the latest snapshot of inventory trends, listing activity, and buyer-seller dynamics across the U.S. housing market.
In addition to our monthly housing trends reports, which offer deeper insights into long-term patterns, we publish these weekly updates to provide more timely views into market changes. This effort began in response to rapid shifts in the economy and housing landscape.
You can count on a new Weekly Housing Trends update, fresh weekly data each Thursday, and a weekly video from our economists to help you stay informed.
What this week’s data shows
New listing activity rebounded strongly following the Easter holiday slowdown, reaching a volume not seen in nearly a year — a fitting surge for the nationally recognized best week to sell. The influx of fresh inventory is welcome news for buyers, who now have more options to choose from at a traditionally opportune time. With mortgage rate uncertainty still in play, tools like realtor.com’s mortgage affordability calculator can help shoppers stress-test their budgets across different rate scenarios — so they can move forward with clarity and confidence, whatever the market brings.
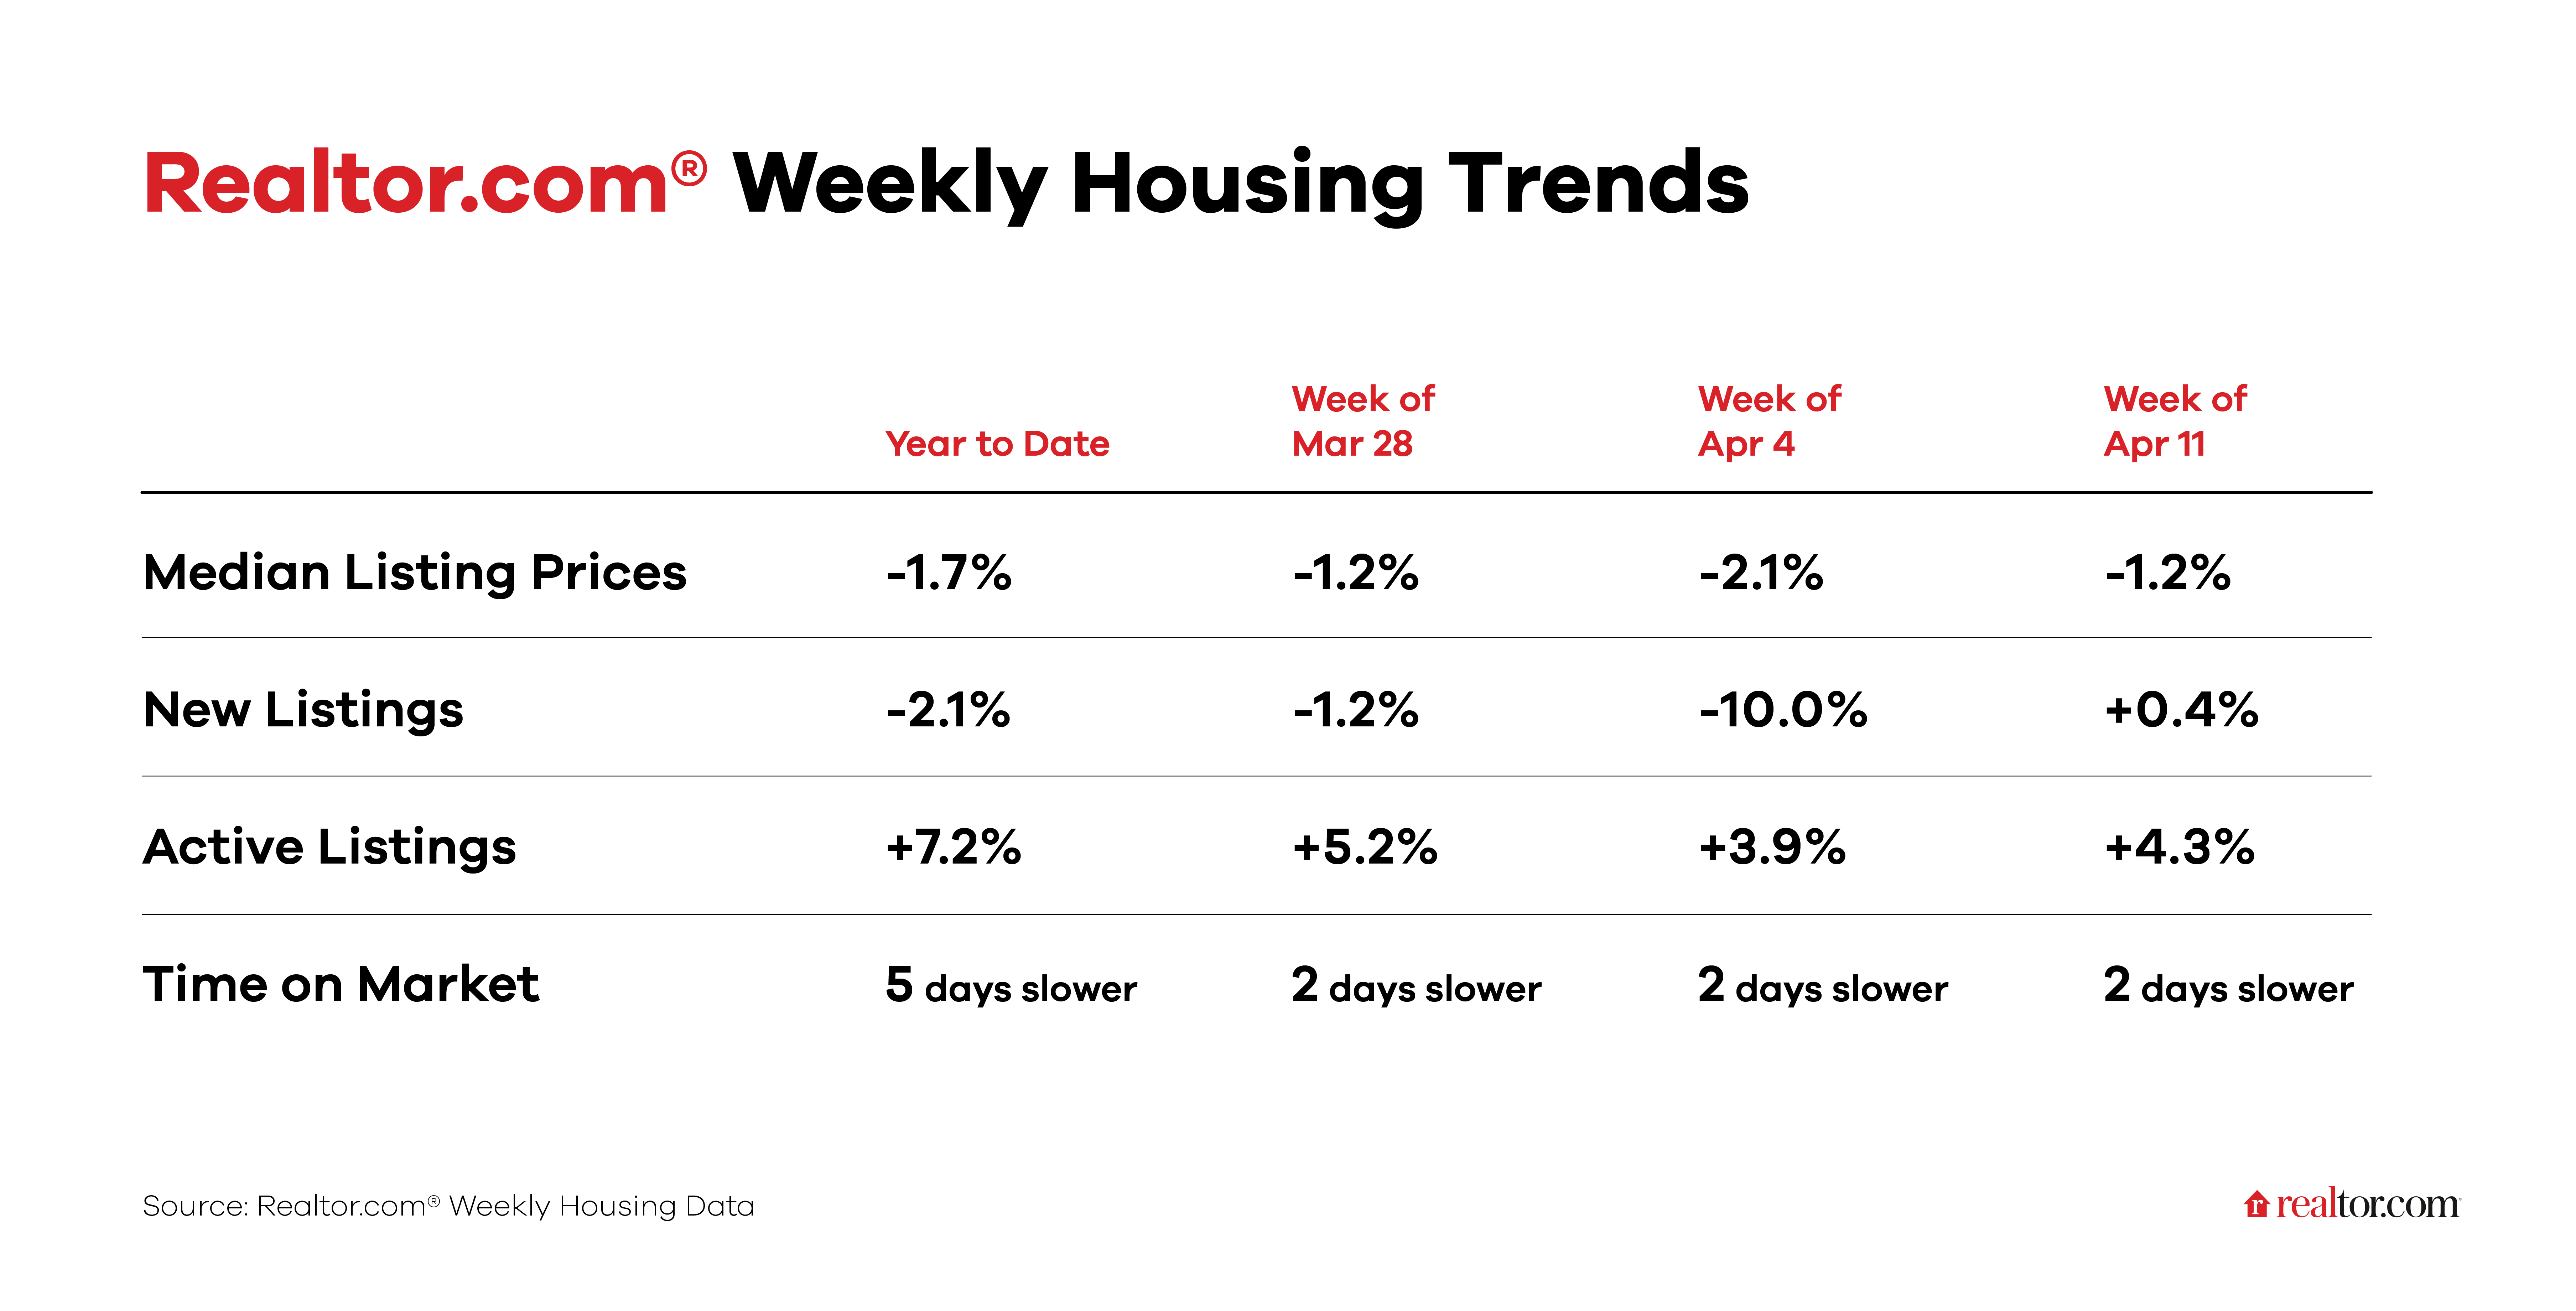
Weekly housing trends highlights
New listings, a measure of sellers putting homes up for sale, increased 0.4% year-over-year
New listing activity bounced back strongly after the Easter holiday slowdown, with the number of newly listed homes surpassing the 120,000 mark — a volume not seen in nearly a year. This surge aligns with the nationally recognized best week to sell, April 12–18, and suggests that sellers are taking advantage of the seasonal window despite ongoing rate volatility. For buyers, the influx of fresh inventory is welcome news, bringing more options to the market at an opportune time.
Active inventory climbed 4.3% year over year
The number of homes for sale continues to outpace year-ago levels, giving buyers more options — a crucial dynamic to the best week to sell. Notably, this marks the first rebound in active inventory after several consecutive weeks of deceleration, making it a meaningful turning point to watch. Whether this upward trend can sustain itself remains an open question. Year-to-date, active inventory is up 7.2%.
Homes spent 2 days longer on the market than a year ago
Time on market held steady at 2 days slower than the same week last year, unchanged from the prior week. In addition, homes are expected to move more quickly in the best week to sell, particularly if buyer demand picks up faster than inventory this spring.
The median listing price fell 1.2% year over year
This marks the 25th consecutive week of flat or negative year-over-year price growth. Asking prices continue to soften, welcome news for buyers navigating an affordability-constrained market. This is also evidenced by the year-over-year price per square foot metric, which fell to -2.4%. The per square foot figure suggests an underlying drop in home prices is taking place, not just a mix of smaller homes coming onto the market.


