

In most markets, luxury is a tier reserved for the top 10% of listings. In the Hailey micropolitan area, that line is less clear. The Hailey micropolitan area encompasses the full Wood River Valley corridor, stretching from the legendary Sun Valley resort and the world-class ski terrain surrounding Ketchum in the north through Hailey, the valley’s largest town and county seat, down to Bellevue in the south. As of March 2026, the median listing price is $1,437,000, exceeding the national luxury threshold of $1,249,611. In a market where 62% of listings are priced above $1 million, the typical home is a luxury home.
Hailey’s Pure Luxury designation, highlighted in the March 2026 Luxury Housing Report, places it in rare company. Only 13 markets in the country clear the bar of having at least half their listings priced above $1 million, with fewer than 500 million-dollar listings. Hailey is one of them, and its story goes well beyond the ski trails.
Luxury Pricing at a Glance
| Hailey, ID Micropolitan Area | USA | |
| Median Listing Price | $1,437,000 | $415,450 |
| Typical Luxury Threshold (90th Percentile) | $8,500,000 | $1,249,611 |
| Typical High-End Luxury Threshold (95th Percentile) | $13,000,000 | $1,997,108 |
| Typical Ultraluxury Threshold (99th Percentile) | $19,800,000 | $5,753,869 |
| Million-Dollar Listing Share | 62% | 13.10% |
A Decade of Appreciation
In June 2016, the median listing price in the Hailey micropolitan area was $699,000, and the 90th percentile threshold sat at $2,845,000. By March 2026, the median had climbed to $1,437,000, more than doubling (105% gain) over the decade. Over the same period, the national luxury threshold (90th percentile) rose approximately 56%, from around $799,000 to $1,249,611. The 90th percentile in Hailey has grown even more dramatically, from $2,845,000 to $8,500,000, an increase of nearly 199%.
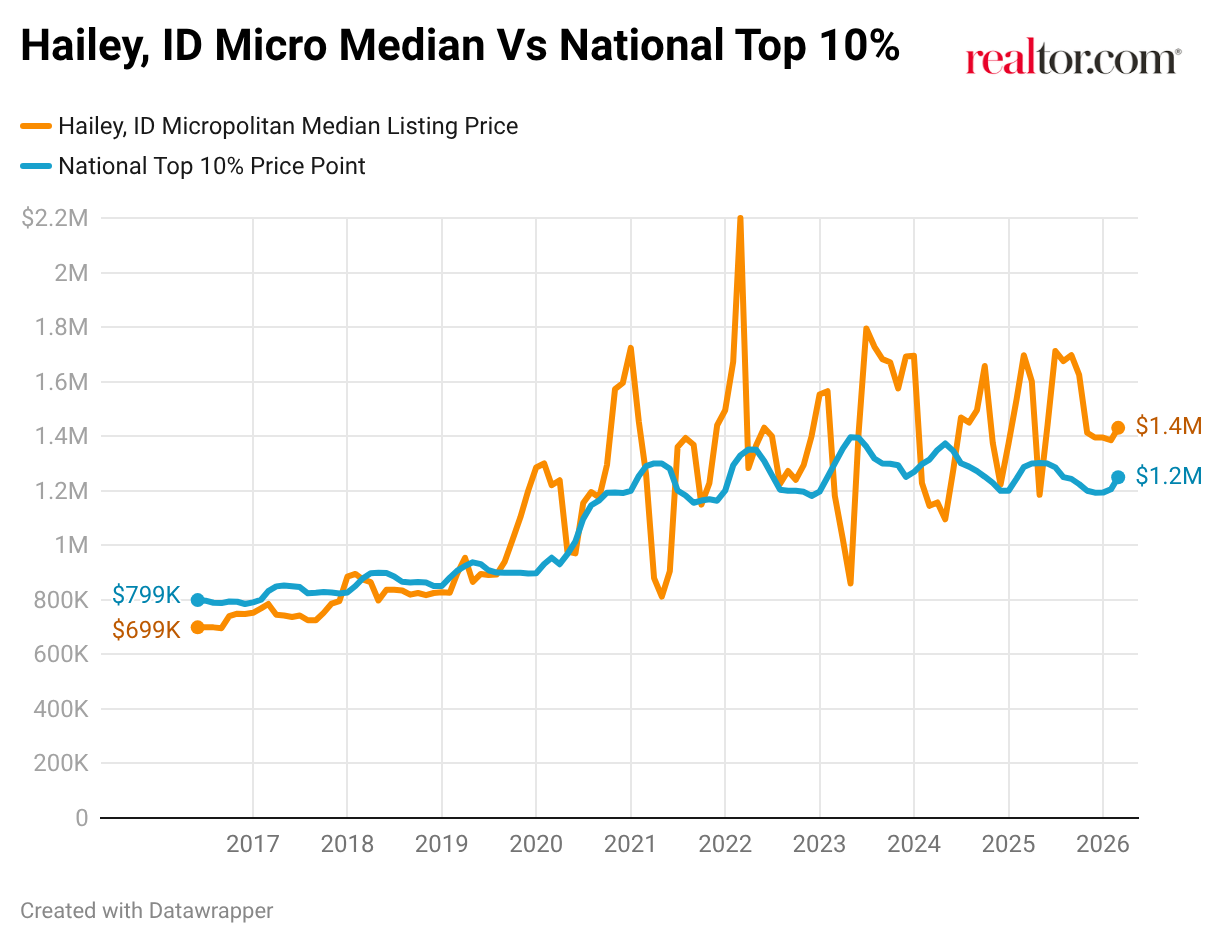
That acceleration is telling, though the path has not been entirely linear. Like many luxury markets, Hailey saw a sharp pandemic-era surge, followed by a recalibration at the median, which peaked at $2,200,000 in March 2022 before settling to its current level of $1,437,000. However, the higher tiers tell a different story. The 90th and 95th percentile thresholds have continued to climb and now exceed their post-pandemic peaks, reflecting sustained, growing demand at the higher end of the market.

The valley’s most acute supply constraints are concentrated in its northern resort core. Ketchum and Sun Valley are effectively hemmed in by the Sawtooth National Recreation Area, steep terrain, and adjacent public lands, leaving little room for meaningful new development. It is precisely there, where land is scarcest, and demand from the most affluent buyers is strongest, that upper-tier prices have continued to climb past their post-pandemic peaks.
The Sun Valley Effect
The Sun Valley area does not just occupy the northern end of the Hailey micropolitan area, it greatly defines it, and that influence traces back to 1936, when the Union Pacific Railroad developed the resort to attract passengers to Idaho. It quickly became a magnet for celebrities, athletes, and wealthy families from across the country, a reputation that has only deepened over the decades. Ernest Hemingway famously called the area home, and Sun Valley continues to draw entertainers, executives, and legacy families who have returned to the valley for generations.

Bloomberg via Getty Images
Friedman Memorial Airport (SUN) in Hailey punches well above its weight, offering seasonal direct flights to Los Angeles, San Francisco, Denver, Seattle, Chicago, San Diego, Phoenix, and Salt Lake City. For a micropolitan area of fewer than 30,000 residents, that level of direct air access is an advantage and a meaningful driver of second-home and investment demand from buyers in major markets. The median household income across those connecting markets ranges from roughly $95,000 in Phoenix to more than $141,000 in San Francisco, above the national median of $86,867. The flight map for the Hailey area is a meaningful window into the buyer pool, connecting Hailey directly to the high-income markets most likely to generate second-home demand, and lowering the friction for affluent buyers who might otherwise look to more traditionally accessible resort destinations. In fact, six of the top ten viewing metros for
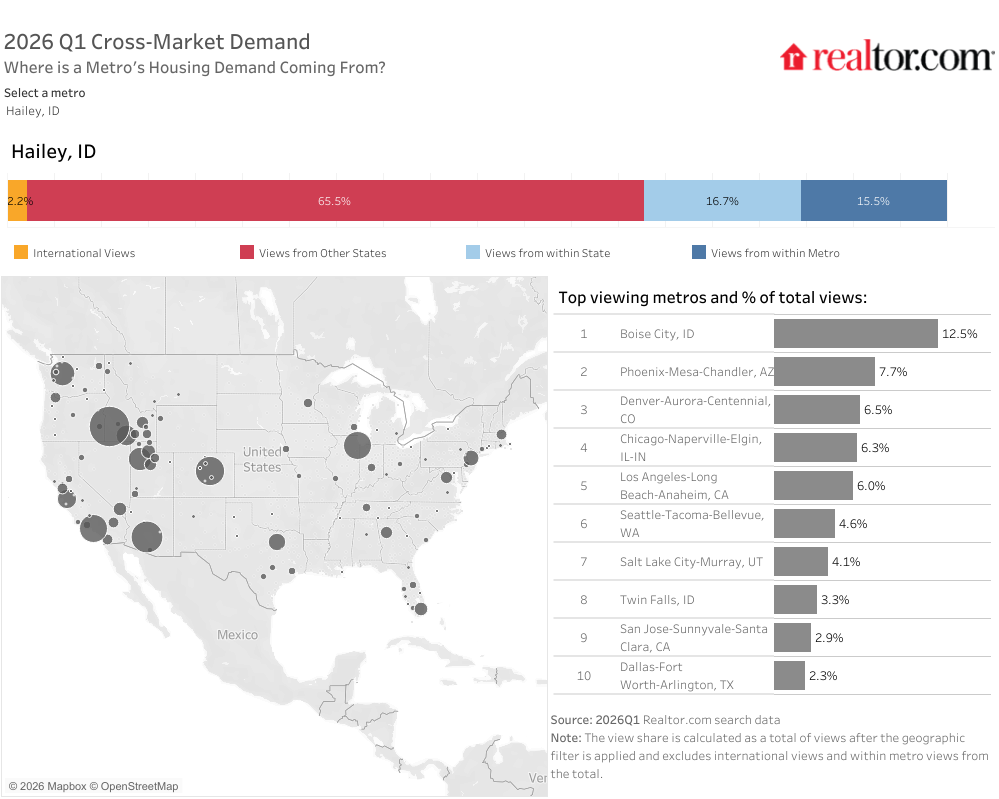
Cross-Market Demand for Hailey, ID
The picture is different further south. Hailey proper and Bellevue sit on flatter valley terrain with more privately held land and less direct adjacency to protected areas, allowing new construction and infill development to continue. That capacity has enabled the broader micro to maintain inventory depth that a fully locked-in resort market like Aspen or Jackson Hole simply cannot offer. In that sense, Hailey shares something with Heber, UT, another mountain luxury market, where the availability of buildable land has similarly allowed new high-end inventory to reach the market, keeping the area accessible relative to its more geographically constrained peers even as prices have climbed substantially.
A Housing Stock Built in Waves
The construction history of Hailey’s luxury housing stock tells the story of two distinct growth waves separated by decades of more modest activity.
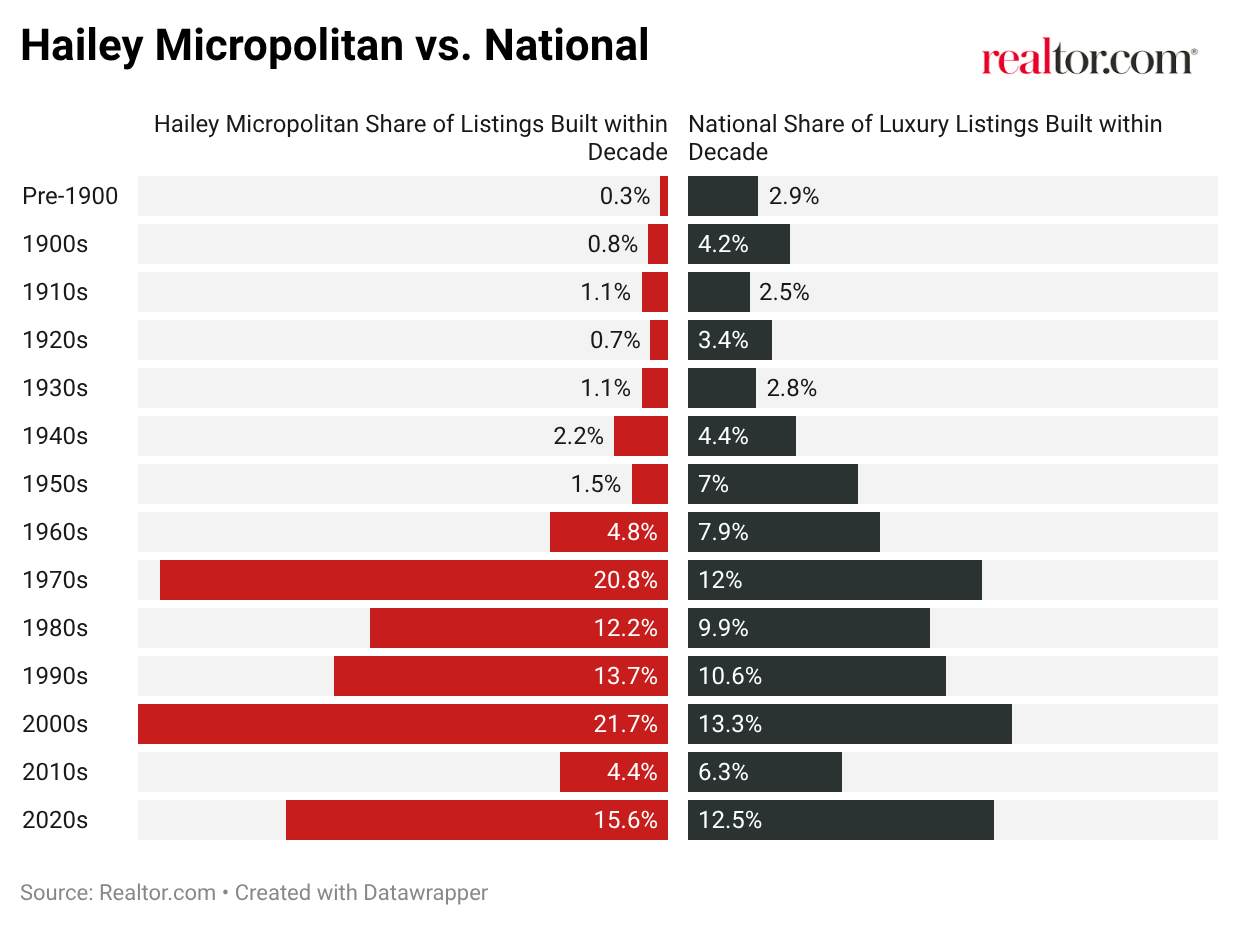
The 1970s represent the first dominant decade of building in Hailey’s history, accounting for 20.8% of the current luxury inventory, compared to just 12.0% nationally. This is also tied to the era when downhill skiing went more mainstream in America and mountain resort communities across the West experienced their first serious wave of vacation-home construction. Sun Valley was already a well-established name by then, and the surrounding area absorbed significant development as demand grew.
The 2000s brought a second, even larger wave: 21.7% of current Hailey luxury inventory was built in that decade, more than any other decade, and well above the national figure of 13.3%. This mirrors the broader national housing boom, amplified by growing demand for luxury mountain homes and the valley’s rising profile among high-net-worth buyers.
The 2010s tell a more constrained story. Just 4.4% of the current inventory was built in that decade, below the national average of 6.3% and the lowest share of any post-1960 decade in the Hailey Micropolitan Area. The post-recession pullback hit mountain resort markets particularly hard, and the combination of tightened financing, reduced vacation-home demand, and limited entitled land slowed construction significantly.
That decade of underbuilding left a thin pipeline heading into the pandemic era, and when demand surged after 2020, much of the available land was consumed quickly. The recent Land Price Study shows that land inventory nationally contracted 23.6% since early 2019 and has yet to recover. In Hailey, the drawdown has been far more severe. Active land listings fell from 483 in March 2019 to 163 in March 2026, a decline of roughly 66%, with the median listing price rising from $219,500 to $360,000 over the same period. That combination, two-thirds of the land supply gone and prices up nearly 64%, tells a story of a market where the raw inputs to future construction are becoming increasingly scarce, even as the broader Western land market has cooled. For a market already operating at the upper end of the national price scale, the cost and availability of future development signals that the floor on Hailey home prices is unlikely to move in the other direction.
The 2020s have seen a rebound, with 15.6% of inventory now from this decade, above the national share of 12.5%. The pandemic-era surge in remote-work-enabled migration to mountain communities brought a new wave of buyers and renewed interest in development in Hailey and Bellevue, where buildable land remains available.
Most Expensive ZIPs in the Hailey, ID Micropolitan Area
Each community within the Hailey micropolitan area carries its own character and price range. Together, they form one of the most uniformly high-value corridors in the American West.
| Rank | ZIP | Area | Median Listing Price | 90th Percentile | Median Square Feet | Median Days on Market | Median Year Built |
| 1 | 83340 | Ketchum | $3,862,500 | $11,937,500 | 2,659 | 81 | 1992 |
| 2 | 83333 | Hailey | $1,437,000 | $5,209,500 | 2,564 | 102 | 2001 |
| 3 | 83353 | Sun Valley | $1,395,000 | $12,842,750 | 1,835 | 92 | 1980 |
| 4 | 83313 | Bellevue | $1,330,500 | $3,134,950 | 2,756 | 73 | 2001 |
(March 2026, Minimum 10 Active Listings)
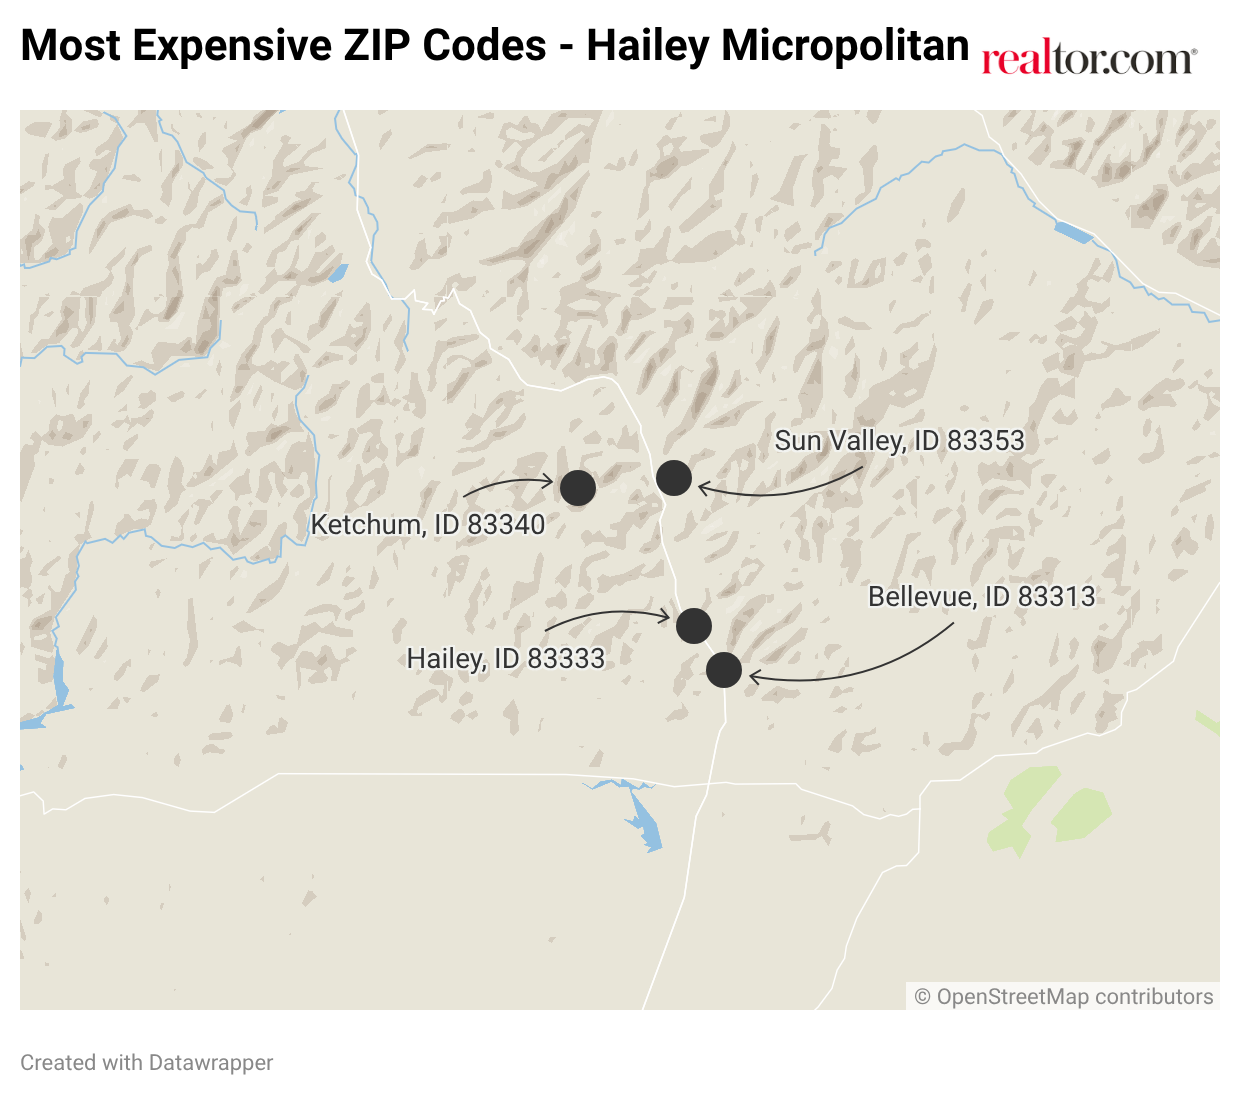
Ketchum (83340) anchors the high end of the valley with a median listing price of $3,862,500, more than double the region-wide median. This is the beating heart of the Sun Valley luxury market, where ski-in/ski-out properties and mountain modern estates command the area’s highest prices. The 90th percentile here reaches $11,937,500, a figure that rivals many of the nation’s most expensive coastal submarkets. With 45 million-dollar listings and a median of 81 days on market, Ketchum remains a high-demand, fast-moving submarket despite its elevated price points. A median year built of 1992 reflects a stock that has seen significant renovation and rebuilding over the decades, layered atop an older resort core.

Getty Images
Sun Valley (83353) presents one of the more striking data contrasts in the valley. Its median listing price of $1,395,000, one of the lowest of the four, sits below Hailey proper, but its 90th percentile of $12,842,750 is the highest of any ZIP in the micro, reflecting a deep upper tier where the valley’s most exclusive resort-adjacent properties are concentrated. A median year built of 1980, the oldest of the four ZIP codes, tells that story directly. The valley’s oldest housing stock and its highest upper-tier prices occupy the same geography, a product of legacy construction, near-zero new supply, and decades of demand concentrated at the resort’s doorstep.
Hailey proper (83333), the micropolitan’s county seat and largest town, posts a median of $1,437,000 and a 90th percentile of $5,209,500. The town serves as the valley’s year-round community hub, home to full-time residents, local businesses, Friedman Memorial Airport, and luxury homebuyers drawn by its value proposition relative to Ketchum. Of the four ZIP codes, Hailey has the longest median days on market at 102, consistent with a broader, more varied inventory pool that takes longer to clear than the more demand-concentrated resort zones.
Bellevue (83313), the southernmost community in the micro, offers the “most accessible” price point at a $1,330,500 median. Bellevue’s 73-day median days on market, the fastest of the four, suggests buyers are moving quickly at lower relative price points. With the largest median square footage at 2,756, Bellevue also offers the best value per square foot of the primary luxury submarkets. With a median year built of 2001, matching Hailey proper, Bellevue reflects the same southern-valley construction era, a reminder that the newer inventory that enables the broader micro’s depth is concentrated here rather than in the older resort core to the north.
The Takeaway
The Hailey micropolitan area stands apart from most of the country not because of what it sits atop, but because of where it starts. This is a market where the median home already exceeds the national luxury threshold, where 62% of listing dollars are in million-dollar territory, and where even the most accessible communities in the valley carry a median above $1.3 million is a market operating on fundamentally different terms compared to most of the country.
Sun Valley’s nearly nine-decade legacy as a premier resort destination has created a buyer pool anchored by wealth, lifestyle intent, and long-term commitment rather than short-term market timing. Geographic constraints across much of the valley have kept supply tight, and the addition of direct air access from Hailey’s airport has lowered the friction for affluent buyers in major metro markets. The result is a micropolitan area where luxury is not the exception but the expectation, and where even the compressed ultraluxury ceiling of $19.8 million tells a story of concentrated demand in a market that punches well above its population weight.
For buyers considering mountain luxury markets, Hailey offers something increasingly rare: a fully established resort community with a decades-long track record, an area where full-time livability meets resort-level amenities, and price points that, while elevated by any national standard, remain notably below the stratospheric levels of Aspen or Jackson Hole. The Sun Valley effect is real, and the Hailey micro is where it translates most directly into real estate.
All data in this report is sourced from Realtor.com® listing trends as of March 2026, reflecting active inventory of existing homes, including single-family residences, condos, townhomes, row homes, and co-ops. Listings reflect only those provided by MLS platforms to Realtor.com through a listing feed. New-construction listings are excluded unless actively listed on participating MLSs.
Luxury segmentation is based on market-specific price percentiles, with the 90th percentile representing entry-level luxury, the 95th percentile marking high-end luxury, and the 99th percentile indicating ultraluxury. All calculations are based on listing prices, not final sales prices.
Metropolitan and micropolitan areas are defined using the Office of Management and Budget’s OMB-2023 delineations, with Claritas 2025 household estimates used for relative comparisons. Where appropriate, we limited analysis to metros or micros with a minimum threshold of active million-dollar listings on average over the past year to ensure meaningful comparisons.
Historical listing trend data extends to July 2016, but year-over-year comparisons in this report use March 2025 as the baseline.
Luxury by the Numbers
90th percentile = Entry-level luxury (top 10% of prices)
95th percentile = High-end luxury
99th percentile = Ultraluxury (often rare or custom properties)


