

Market outlook
Like the rest of the economy, the housing market found itself facing a familiar foe in May: inflation. April’s consumer price index came in at 3.8%, driven by the Iran war, and inflation nowcasts estimate May’s number will be closer to 4.2%. Rising prices deliver a double blow to consumers, eating away at paychecks and savings while driving up bond yields and, therefore, mortgage rates at the same time. Mortgage rates climbed from 6.30% to 6.53% throughout May, erasing much of April’s relief and presenting yet another round of housing market headwinds for the spring selling season.
But yet again, May has extended spring’s quietly promising run. Year-on-year listing prices fell for a seventh straight month—by 2.4%, representing the steepest year-over-year decline in Realtor.com® data going back to 2017—while homes under contract rose for a sixth straight month. Those two trends are not a contradiction; they are two sides of the same coin. Sellers are pricing to sell rather than pricing to test the market. Buyers, despite rates remaining higher than expected, are still showing up when prices are within budget.
In This Report
May’s top storylines, according to the data
Asking prices are falling—broadly and at a record pace.
Median list prices dropped 2.4% year over year in May, the steepest decline in Realtor.com® data since 2017, with prices per square foot down 2.5% and falling in 35 of the top 50 metros.
Buyers are responding, as pending sales rose for a sixth straight month.
Pending listings (+4.3% YoY) and the rate of contract signings (+3.5% YoY) are up compared to May 2025. New listings (+2.1% YoY) also hit their highest May level since 2022, as the most active spring market in four years continues.
Some regional inventory patterns have flipped.
New listings surged in the Northeast (+8.6%) and Midwest (+4.7%), while new and active listings growth stalled in the South and West, where rising days on the market suggest the macro headwinds may not yet have made their full mark.
Key questions
Q: Mortgage rates climbed from 6.30% to 6.53% in May. Did the housing market pull back?
A: Not meaningfully—but it doesn’t mean it won’t in the future. Between higher inflation and mortgage rates and cratering consumer sentiment, a pullback would have been easy to explain. Instead, new listings grew, pending sales extended their streak to six months, and the price cut share fell. The market’s resilience likely does have limits, but it’s clear that, in general, buyers and sellers have recalibrated to an environment where higher rates and economic uncertainty are to be expected, rather than a shock.
Q: Prices are falling quickly and in most major metros—are we in a market crash?
A: No—and the seller price-reduction data tells you why. In a crashing market, sellers list optimistically and get forced to cut and then sell well below asking price. What we’re seeing is different in a key way: List prices are down 2.4%, but the share of listings with price cuts also fell, by 1.6 percentage points. Sellers aren’t testing the market’s ceiling and retreating. They are using market signals as price discovery, pricing their home for current conditions—not selling under distress. This is also the key difference between this spring and last year’s Cruel Summer, when sellers held firm on stale price expectations, buyers pulled back, and the gap between them widened as the market stalled. The fact that prices are lower this May is likely why buyers are still at the table despite higher interest rates and economic uncertainty.
Q: What should we be monitoring heading into June?
A: Two things. First, contract cancellations and delistings. May and June 2025 were when the tariff-driven uncertainty went beyond consumer sentiment statistics and actually bled through into behavior. Cancellations increased, and there was a large and sustained spike in sellers pulling their homes from the market. Those are the leading indicators of market stress and a sales slowdown. So far in 2026, cancellations have remained lower than in the past several years. If that holds through June, we can say with more confidence that the Iran war uncertainty is landing differently than last year’s tariff shock: felt in rates and sentiment, but not yet in transaction behavior. A second thing to watch is whether the Northeast and Midwest supply unlock sustains. If new and active listings continue to grow in those inventory-starved regions, that’s a key sign the market is normalizing.
Back to top
Core metrics: May 2026
Median list price: $429,500
- vs. previous month: Up 1.1%, a typical seasonal pattern
- vs. previous year: Down 2.4%, the seventh straight month of falling year-over-year prices, and the largest drop since Realtor.com data began in 2017
The price per square foot—a gauge of home values that accounts for the size of homes on the market—moved similarly: +0.6% month over month, -2.5% year over year, which is also the largest annual drop in our data series.
At the regional level: Year-over-year median list prices fell in each of the four major regions, running from -4.0% in the West to -1.2% in the Midwest. When adjusting for changing home sizes, median prices per square foot rose more in the Midwest (+1.2%), were flat in the Northeast (0.0%), and fell more in the South (-3.4%) and West (-2.0%).
At the metro level: The median list price per square foot is falling in 35 of the top 50 metros, the same number as last month. The largest per-square-foot price declines were in Austin (-8.3%), Memphis (-5.9%), and Buffalo (-5.8%). The largest gains were in Providence (+9.1%), Indianapolis (+5.0%), and Cleveland (+3.1%).
Active listings: 1,058,693
- vs. previous month: Up 5.6%
- vs. previous year: Up 2.2%

Year-on-year active listings growth is down from last month (when it was +4.0%). In general, year-on-year listing growth has been decelerating since last spring. Nationwide inventory is 11.6% below typical 2017–19 levels, about the same as the 12.5% shortfall last month.
At the regional level: Inventory increased across the board, with larger gains in the Midwest (+8.2% YoY) and Northeast (+7.1%). Growth is largely flat in the West (+1.4%) and South (+0.3%).
At the metro level: 36 of the 50 largest markets recorded year-over-year inventory growth, down from 39 last month. The sharpest increases were seen in Louisville (+32.7%), Cincinnati (+25.7%), and Indianapolis (+21.9%).
New listings: 474,976
- vs. previous month: Down 0.4%
- vs. previous year: Up 2.1%

At the regional level: New listings growth was especially strong in the Northeast (+8.6% YoY, -0.9% MoM) and Midwest (+4.7% YoY, +2.9% MoM), and muted in the South (+0.6% YoY, -3.1% MoM) and West (-1.4% YoY, +1.2% MoM).
At the metro level: Metros with the strongest new listing growth year over year were Buffalo (+19.9%), Providence (+18.1%), and Richmond (+17.5%).
Time on the market: 52 days
- vs. previous year: +1 day slower

This marks the 26th straight month of homes taking longer to sell on a year-over-year basis. The median home has spent 1 fewer day on the market than the pre-pandemic norm.
Regional and metro levels: Time on the market is now lower in the Northeast than a year ago (-1 day), likely due in large part to an influx of new listings. Days on the market remain modestly up in the Midwest (+1), South (+1), and West (+4), and grew in 37 of the top 50 metros (down from 43 last month). Time on the market has increased the most in Austin (+10 days), Tampa (+7), and Seattle (+6).
Pending sales and contract activity
Stock of listings in pending status:
- vs. previous year: Up 4.3%, the sixth straight month of year-over-year growth
We have not seen six straight months of year-over-year pending sales growth since January through June 2021.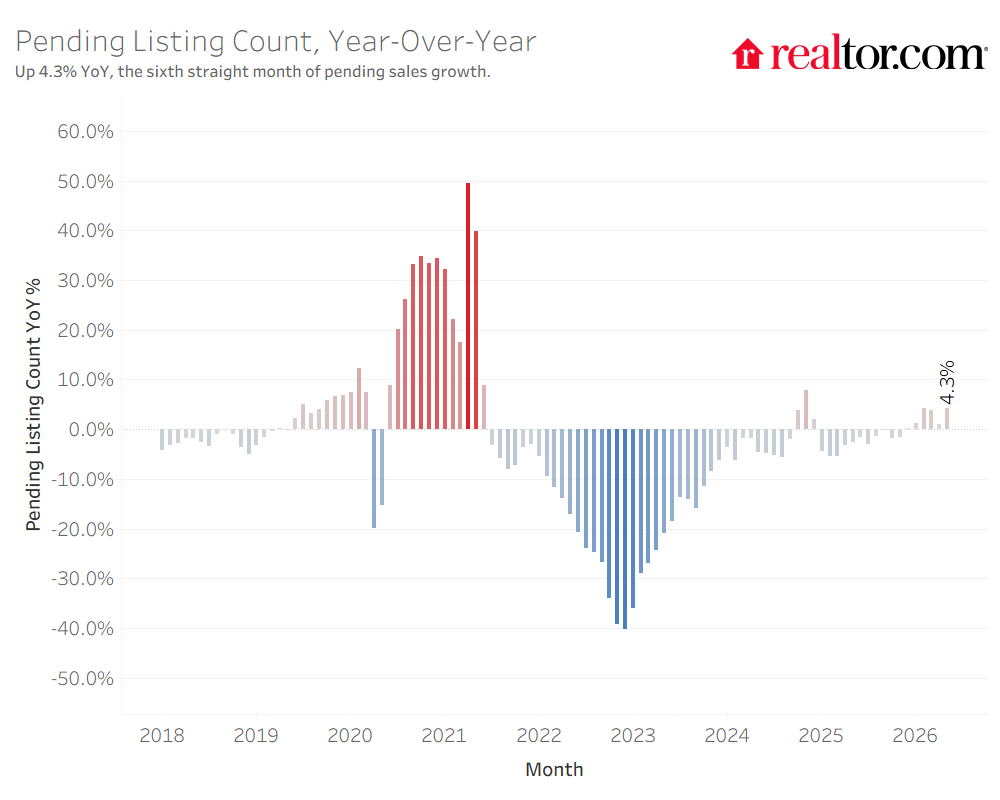
Flow of new contract signings:
- vs. previous year: Up 2.6% in May
Price cuts: 17.5% of listings saw a price cut in May
- vs. previous year: Down 1.6 percentage points

Compared to last year, 2026 has seen both fewer price cuts and lower median list prices, suggesting sellers have internalized the generally more buyer-friendly market conditions and are adjusting price expectations before rather than after listing.
Regional and metro levels: Price cuts remain less common in the Northeast (11.3% of listings) and Midwest (14.3%) compared to the South (19.4%) and West (19.0%).
Back to top
Summary tables
National
| Metric | May 2026 | Change Over April 2026 (MoM) | Change Over May 2025 (YoY) | Change Over May 2019 | Change Over May 2022 |
| Median listing price | $429,500 | 1.1% | -2.4% | 34.2% | -1.8% |
| Active listings | 1,058,693 | 5.6% | 2.2% | -10.4% | 120.8% |
| New listings | 474,976 | -0.4% | 2.1% | -18.7% | -9.8% |
| Median days on market | 52 | 0 | 1 | 1 | 23 |
| Share of active listings with price reductions | 17.5% | 0.8 | -1.6 | 2.1 | 7.3 |
| Median List Price Per Sq.Ft. | $228 | 0.6% | -2.5% | 49.5% | 1.3% |
Regional: Listings
| Active Listings | New Listings | ||||||
| May 2026 | YoY | vs. Pre-Pandemic | May 2026 | YoY | vs. Pre-Pandemic | ||
| U.S. Avg. | 1,058,693 | 2.2% | -11.6% | 474,976 | 2.1% | -17.7% | |
| Northeast | 106,318 | 7.1% | -49.0% | 64,220 | 8.6% | -31.5% | |
| Midwest | 147,150 | 8.2% | -36.2% | 95,880 | 4.7% | -22.1% | |
| South | 577,682 | 0.3% | 3.9% | 210,604 | 0.6% | -6.5% | |
| West | 224,621 | 1.4% | 12.4% | 101,484 | -1.4% | -23.3% | |
Regional: Prices
| Median List Price | Median List Price per Sq. Ft. | ||||||
| May 2026 | YoY | vs. Pre-Pandemic | May 2026 | YoY | vs. Pre-Pandemic | ||
| U.S. Avg. | $429,500 | -2.4% | 43.7% | $228 | -2.5% | 59.3% | |
| Northeast | $549,900 | -1.8% | 63.9% | $312 | 0.0% | 82.7% | |
| Midwest | $325,000 | -1.2% | 47.0% | $183 | 1.2% | 60.2% | |
| South | $389,000 | -2.5% | 37.7% | $206 | -3.4% | 55.5% | |
| West | $600,000 | -4.0% | 39.9% | $323 | -2.0% | 57.5% | |
Regional: Market pressures
| Median Time on Market | Share of Listings With Price Cuts | ||||||
| May 2026 | YoY | vs. Pre-Pandemic | May 2026 | YoY | vs. Pre-Pandemic | ||
| U.S. Avg. | 52 | 1 | 0 | 17.5% | -1.6 | 1.0 | |
| Northeast | 39 | -1 | -14 | 11.3% | 0.1 | -3.7 | |
| Midwest | 40 | 1 | -8 | 14.3% | -0.4 | -2.1 | |
| South | 58 | 1 | -1 | 19.4% | -2.1 | 2.0 | |
| West | 50 | 4 | 9 | 19.0% | -2.2 | 3.6 | |
Back to top
Appendix: May 2026 statistics
May 2026 National and Regional Housing Overview
| Region | Active Listing Count, YoY | New Listing Count, YoY | Median List Price | Median List Price, YoY | Median List Price per SF, YoY | Median Days on Market, YoY (Days) | Price-Reduced Share | Price-Reduced Share, YoY (Percentage Points) |
| Northeast | 7.1% | 8.6% | $549,900 | -1.8% | 0.0% | -1 | 11.3% | 0.1 |
| Midwest | 8.2% | 4.7% | $325,000 | -1.2% | 1.2% | 1 | 14.3% | -0.4 |
| South | 0.3% | 0.6% | $389,000 | -2.5% | -3.4% | 1 | 19.4% | -2.1 |
| West | 1.4% | -1.4% | $600,000 | -4.0% | -2.0% | 4 | 19.0% | -2.2 |
| National Average | 2.2% | 2.1% | $429,500 | -2.4% | -2.5% | 1 | 17.5% | -1.6 |
May 2026 Housing Overview of the 50 Largest Metros
| Metro | Active Listing Count YoY | New Listing Count, YoY | Median List Price | Median List Price, YoY | Median List Price per SF, YoY | Median Days on Market, YoY (Days) | Price-Reduced Share | Price-Reduced Share, YoY (Percentage Points) |
| Atlanta-Sandy Springs-Roswell, GA | 2.6% | -6.1% | $425,000 | 1.2% | 0.4% | 3 | 20.4% | -2.9 |
| Austin-Round Rock-San Marcos, TX | -4.4% | -13.3% | $475,000 | -9.5% | -8.3% | 10 | 26.8% | -2.4 |
| Baltimore-Columbia-Towson, MD | 13.2% | 8.3% | $389,900 | -2.5% | -1.3% | 3 | 16.5% | 1.3 |
| Birmingham, AL | 8.2% | 4.9% | $299,900 | 0.0% | 0.0% | 3 | 16.4% | -1.8 |
| Boston-Cambridge-Newton, MA-NH | 11.0% | 12.1% | $849,000 | -3.4% | -1.6% | -1 | 14.1% | -2.3 |
| Buffalo-Cheektowaga, NY | 17.3% | 19.9% | $265,000 | -11.6% | -5.8% | 1 | 6.9% | -0.1 |
| Charlotte-Concord-Gastonia, NC-SC | 17.6% | 5.8% | $439,000 | -2.4% | -2.1% | 3 | 22.8% | -0.8 |
| Chicago-Naperville-Elgin, IL-IN | -10.7% | -13.0% | $389,000 | 2.4% | 1.2% | 1 | 11.1% | -0.5 |
| Cincinnati, OH-KY-IN | 25.7% | 14.3% | $350,000 | -1.4% | 0.8% | 3 | 16.0% | 1.4 |
| Cleveland, OH | 4.6% | 4.6% | $269,900 | -1.9% | 3.1% | 1 | 13.7% | -0.5 |
| Columbus, OH | 10.4% | 9.0% | $379,800 | -2.6% | -0.5% | -2 | 19.0% | -2.1 |
| Dallas-Fort Worth-Arlington, TX | -3.7% | -3.9% | $435,999 | -0.9% | -1.9% | 3 | 24.0% | -3.0 |
| Denver-Aurora-Centennial, CO | -7.2% | -2.6% | $589,000 | -1.8% | -3.5% | 5 | 25.5% | -3.9 |
| Detroit-Warren-Dearborn, MI | 16.7% | 5.5% | $264,900 | -1.9% | -0.6% | 3 | 14.0% | 0.3 |
| Hartford-West Hartford-East Hartford, CT | 0.6% | 8.9% | $475,000 | 1.2% | -1.3% | -5 | 7.3% | 0.5 |
| Houston-Pasadena-The Woodlands, TX | 3.5% | -13.3% | $360,000 | -3.4% | -2.4% | 5 | 18.4% | -1.5 |
| Indianapolis-Carmel-Greenwood, IN | 21.9% | 12.9% | $320,000 | -3.5% | 5.0% | 3 | 22.4% | 1.1 |
| Jacksonville, FL | -22.3% | -3.4% | $394,900 | -2.5% | -2.9% | -1 | 22.9% | -5.9 |
| Kansas City, MO-KS | 17.3% | -9.3% | $415,000 | 1.2% | 0.8% | -4 | 12.4% | -1.9 |
| Las Vegas-Henderson-North Las Vegas, NV | 6.7% | -1.4% | $474,900 | -2.1% | -2.2% | 5 | 21.8% | -3.6 |
| Los Angeles-Long Beach-Anaheim, CA | 2.0% | -4.2% | $1,100,000 | -7.9% | -3.0% | 2 | 14.3% | -1.4 |
| Louisville/Jefferson County, KY-IN | 32.7% | 6.1% | $319,900 | -2.2% | -0.2% | 0 | 18.3% | 1.8 |
| Memphis, TN-MS-AR | 16.2% | 1.2% | $304,495 | -13.0% | -5.9% | 1 | 22.3% | 0.5 |
| Miami-Fort Lauderdale-West Palm Beach, FL | -15.4% | -5.3% | $499,000 | -2.2% | -1.3% | 2 | 15.3% | -4.4 |
| Milwaukee-Waukesha, WI | 10.7% | -2.8% | $395,000 | -1.1% | 2.5% | 3 | 9.3% | -1.4 |
| Minneapolis-St. Paul-Bloomington, MN-WI | 11.3% | 10.1% | $434,900 | -2.5% | -0.5% | 1 | 14.0% | 1.1 |
| Nashville-Davidson–Murfreesboro–Franklin, TN | 13.3% | 5.0% | $539,900 | -1.6% | -0.8% | 3 | 18.7% | -2.3 |
| New York-Newark-Jersey City, NY-NJ | 4.2% | 5.3% | $775,000 | -2.5% | -0.3% | -3 | 9.3% | 0.6 |
| Oklahoma City, OK | 9.7% | 4.1% | $319,000 | -3.3% | -0.9% | 6 | 19.0% | -1.8 |
| Orlando-Kissimmee-Sanford, FL | -4.2% | 3.7% | $419,900 | -2.3% | -3.4% | 5 | 20.6% | -4.6 |
| Philadelphia-Camden-Wilmington, PA-NJ-DE-MD | 9.8% | 7.5% | $385,000 | 0.0% | -0.1% | 1 | 14.2% | 0.0 |
| Phoenix-Mesa-Chandler, AZ | -4.1% | 9.5% | $498,000 | -5.1% | -2.1% | 2 | 28.2% | -3.1 |
| Pittsburgh, PA | 7.9% | 9.1% | $250,000 | 0.0% | 1.6% | -1 | 16.8% | 1.0 |
| Portland-Vancouver-Hillsboro, OR-WA | 1.2% | -0.6% | $596,142 | -2.4% | -2.5% | 3 | 25.4% | -1.4 |
| Providence-Warwick, RI-MA | 3.7% | 18.1% | $589,999 | -0.8% | 9.1% | 0 | 9.5% | -1.0 |
| Raleigh-Cary, NC | 6.2% | 8.8% | $458,000 | 0.3% | -1.6% | 1 | 21.8% | -1.6 |
| Richmond, VA | 4.4% | 17.5% | $449,999 | -2.2% | 2.3% | -1 | 11.4% | -1.1 |
| Riverside-San Bernardino-Ontario, CA | -4.3% | -4.0% | $595,000 | -0.8% | -2.3% | 3 | 16.6% | -3.2 |
| Sacramento-Roseville-Folsom, CA | -6.8% | -7.1% | $634,900 | -0.6% | 0.0% | 3 | 18.7% | -4.1 |
| Salt Lake City-Murray, UT | 5.9% | 6.1% | $564,995 | -3.4% | 0.5% | 1 | 23.4% | -3.7 |
| San Antonio-New Braunfels, TX | 5.7% | -1.7% | $325,000 | -4.4% | -5.1% | -1 | 26.4% | 1.4 |
| San Diego-Chula Vista-Carlsbad, CA | -3.1% | 4.4% | $939,450 | -5.6% | -3.9% | 1 | 17.4% | -2.5 |
| San Francisco-Oakland-Fremont, CA | -16.5% | -8.1% | $998,250 | -0.1% |


